
Fig. 3.
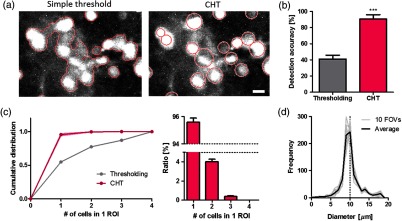
CHT identifies most of the cell bodies as a single ROI. (a) The same image processed with simple thresholding and CHT algorithm. Each area outlined a red curve in simple threshold or circle in CHT indicates each ROI. (b) The ratio of identified ROI numbers to the number of cells that were manually detected (; ; ). (c) The cumulative distribution of the number of cells detected as one ROI (left) with simple thresholding (gray) and CHT (magenta) and the normalized histogram of CHT (right; ; ). (d) The distribution of ROI diameters in 10 field-of-views (gray) and average (black). The scale bar in (a) indicates .