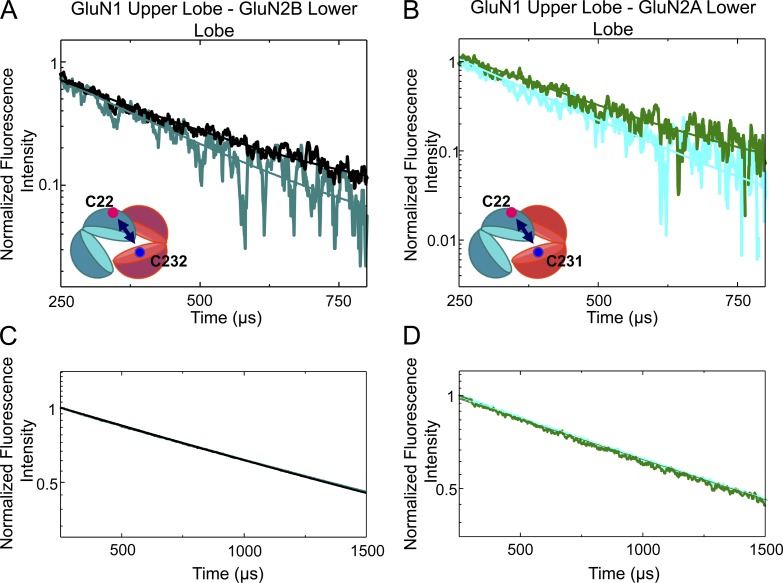
Figure 5.
LRET measurements showing movement of lower lobe of GluN2 ATD. (A) Changes in the LRET lifetime induced by ifenprodil are shown as measured between C22 on GluN1 and C232 on GluN2B. In black is the LRET lifetime from the apo receptor, and in teal is the lifetime with ifenprodil. (B) Zinc similarly induces a reduction in the distance between the GluN1 ATD upper lobe and the GluN2A ATD lower lobe, as measured between C22 on GluN1 and C231 on GluN2A. The lifetimes from apo receptor are in green, and the zinc-bound receptor is in cyan. The acceptor fluorophore used for the LRET in A and B was Alexa Fluor 555. (C) The donor-only lifetimes from the apo (black) and ifenprodil-bound (teal) receptor. The donor-only lifetimes from the GluN1*C22-GluN2A*231 (D) receptor in the presence (cyan) and absence (green) of zinc are shown.

