Figure 3.
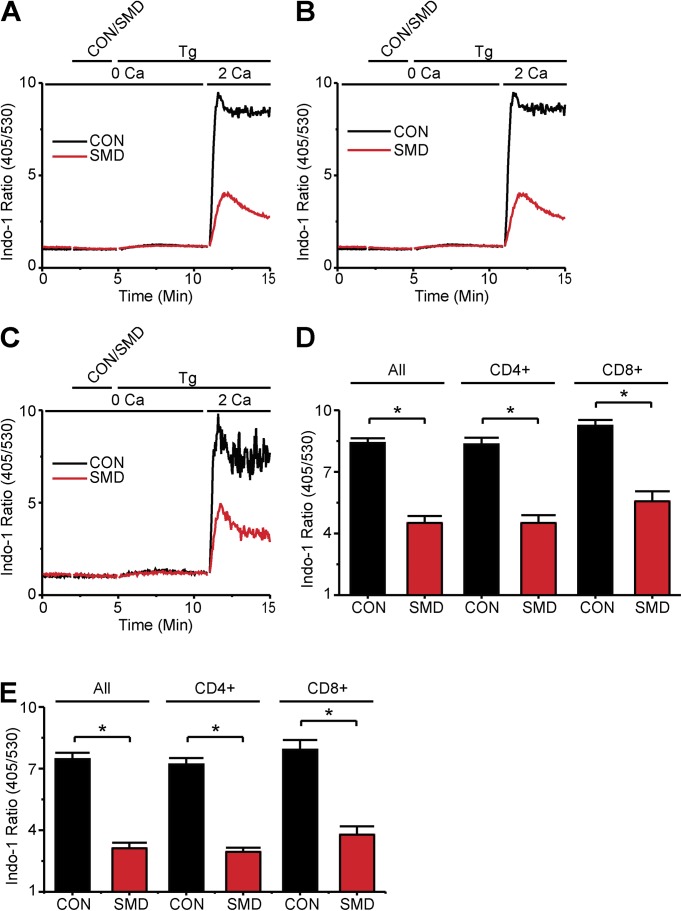
SMase D suppresses SOCE in CD4 and CD8 T lymphocyte subsets. (A–C) Indo-1 ratio signals of total T cells (A), CD4-positive T cells (B), and CD8-positive T cells (C), where the upper bar above each panel indicates the following: after 2-min rest, cells were treated with SMase D (SMD, red) or catalytically inactive enzyme (CON, black) for 3 min and 1 µg Tg for 10 min; the lower bar above each panel shows Ca2+-containing solution type before and after the addition of 5 µl of 100 mM CaCl2 at 11 min, which results in a final Ca2+ concentration of ∼2 mM. (D and E) Peak (D) and declining phase (E) values (error bars represent mean ± SEM; n = 5) of indo-2 ratio signals from Tg-stimulated cells for experiments as shown in A–C. Where present, the asterisks denote statistically significant comparisons as detailed in Materials and methods.

