Figure 4.
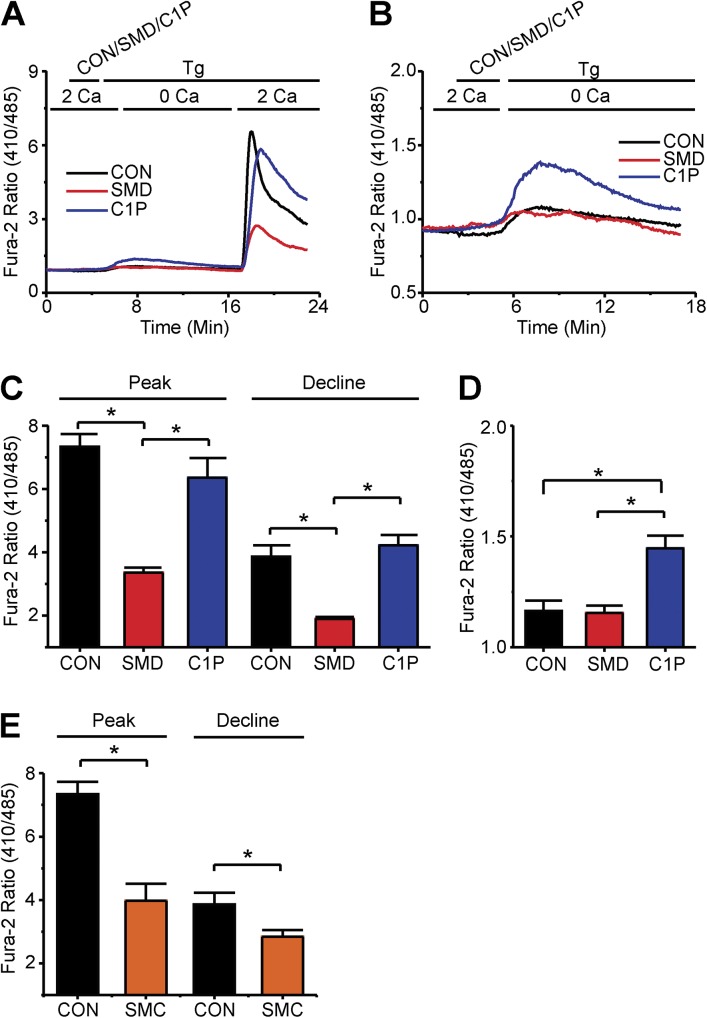
T lymphocyte SOCE is inhibited by SMases but not C1P. (A) Fura-2 ratio signals of (35–45) T cells, where the upper bar above the panel indicates treatments: after 2-min rest, cells were treated with SMase D (SMD, red), C1P (blue), or catalytically inactive enzyme (CON, black) for 3 min and 1 µg Tg for 18 min; the lower bar shows the Ca2+-containing solution type. Cells treated with C1P were also bathed in 0.5 mg/ml of C1P-containing solutions throughout the Tg treatment period. (B) Fura-2 ratio signals from experiments shown in A but with axes rescaled to better show the internal store release component for cells treated with SMD (red), C1P (blue), or CON (black). (C) Peak and declining phase (23 min) values (error bars represent mean ± SEM; n = 5) of Fura-2 ratio signals from Tg-stimulated cells for experiments as shown in A. (D) Peak values (error bars represent mean ± SEM; n = 5) of Fura-2 ratio signals from Tg-stimulated cells in experiments as shown in B. (E) Peak and declining phase values (error bars show mean ± SEM; n = 5) of Fura-2 ratio signals from Tg-stimulated cells treated with SMase C (SMC, orange) or CON (black). Where present, the asterisks denote statistically significant comparisons as detailed in Materials and methods.

