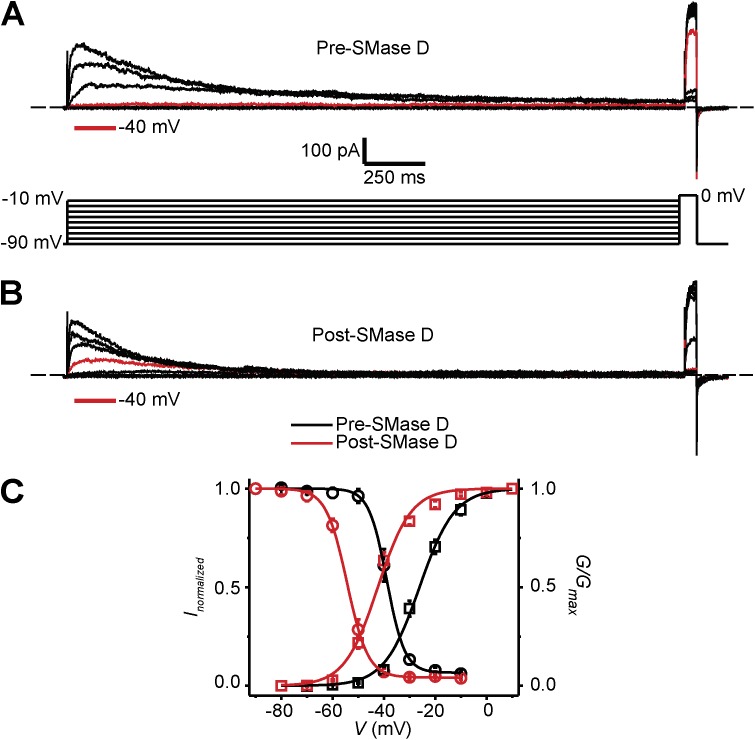
Figure 5.
Effect of SMase D on C-type inactivation of KV1.3 channels in human T lymphocytes. (A and B) KV1.3 currents elicited by stepping membrane voltage at 30-s intervals from the −100-mV holding potential to a first pulse between −90 and −10 mV in 10-mV increments followed by a second test pulse to 0 mV, before (A) and after (B) the addition of SMase D to the bath solution (0.25 µg/ml). Current traces for −40 mV are colored red; dashed lines indicate zero current levels. (C) G-V curves (squares) and h-infinity curves (circles) of KV1.3 channels in T cells before (black) and after (red) SMase D treatment; error bars represent means ± SEM (n = 5). The curves are fits of Boltzmann functions, yielding: V1/2 = −38.8 ± 0.2 mV and Z = 7.3 ± 0.4 (black circles); V1/2 = −54.4 ± 0.2 mV, Z = 6.3 ± 0.2, and c = 0.04 ± 0.01 (red circles); V1/2 = −26.1 ± 0.4 mV and Z = 3.7 ± 0.2 (black squares); and V1/2 = −42.4 ± 0.6 mV and Z = 4.0 ± 0.3 (red squares).

