Figure 6.
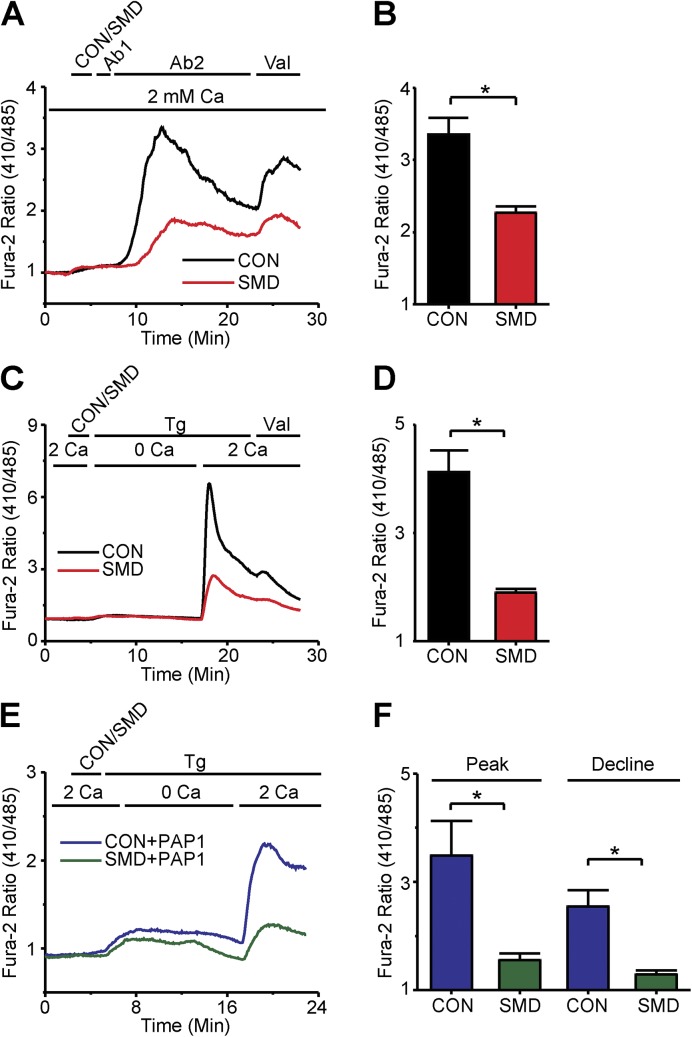
Inhibition of SOCE by SMase D does not depend on decreased K+ conductance. (A) Fura-2 ratio signal of (26–54) T cells in a single 40× field, where the upper bar above the panel indicates these treatments: after 2-min rest, cells were treated with either SMase D (SMD, red) or catalytically inactive enzyme (CON, black) for 3 min, 5 µg anti-CD3ε antibody (Ab1) for 2 min, 5 µg anti-IgG antibody (Ab2) for 18 min, and finally 1 µg valinomycin (Val) for 5 min; the lower bar shows the Ca2+-containing solution type. (B) Peak values (error bars represent mean ± SEM; n = 5) of Fura-2 ratio signals induced by valinomycin as shown in A. (C) Fura-2 ratio signal of (17–31) T cells as in A, where the upper bar above the panel indicates these treatments: after 2-min rest, cells were treated successively with SMD (red) or CON (black) for 3 min, 1 µg Tg for 18 min, and 1 µg valinomycin (Val) for 5 min; the lower bar shows the Ca2+-containing solution type. (D) Peak values (error bars represent mean ± SEM; n = 5) of the valinomycin-induced Fura-2 ratio signals from experiments as shown in C. (E) Fura-2 ratio signals of (19–48) T cells as in A but in the presence of 200 nM PAP-1 throughout, where the upper bar above the panel indicates these treatments: after 2-min rest, cells were treated with either SMD (green) or CON (blue) for 3 min and 1 µg Tg for 18 min; the lower bar shows the Ca2+-containing solution type. (F) Peak and declining phase values (error bars represent mean ± SEM; n = 7) of Fura-2 ratio signals from Tg-stimulated cells in the presence of PAP-1 as shown in E. Where present, the asterisks denote statistically significant comparisons as detailed in Materials and methods.

