Figure 7.
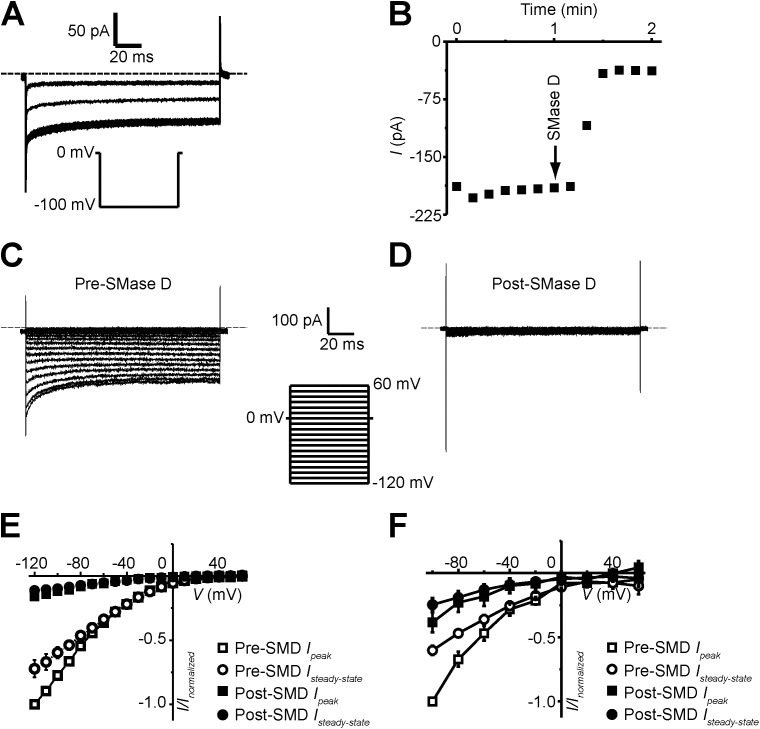
SMase D suppresses Orai1 currents. (A and B) Orai1 currents (A) and steady-state current time course (B) recorded in the presence of 20 mM [Ca2+]ext, elicited by stepping the voltage from the 0-mV holding potential to −100 mV. After the addition of 0.5 µg/ml SMase D, the current was suppressed. (C and D) Orai1 currents elicited by stepping the membrane voltage from the 0-mV holding potential to between −120 and 60 mV in 10-mV increments before (C) and after (D) the addition of SMase D to the bath solution. Dashed lines in A, C, and D indicate zero current levels, and currents traces are shown after correcting for background currents (i.e., those recorded in a nominally Ca2+-free solution). (E) I-V relations of peak (squares) and steady-state current (circles) before (open) and after (closed) treatment with 0.5 µg/ml SMase D. Peak currents in E were measured as the mean current over a 0.5-ms window 2.0 ms after the start of the voltage step, and steady-state currents in B and E were measured as the mean current of a 40-ms window 100 ms after the start of the voltage step in A and C, or D, respectively. (F) Jurkat whole-cell Orai1 I-V relations of peak (squares) and steady-state current (circles) before (open) and after (closed) treatment with 0.5 µg/ml SMase D. Error bars represent mean ± SEM.

