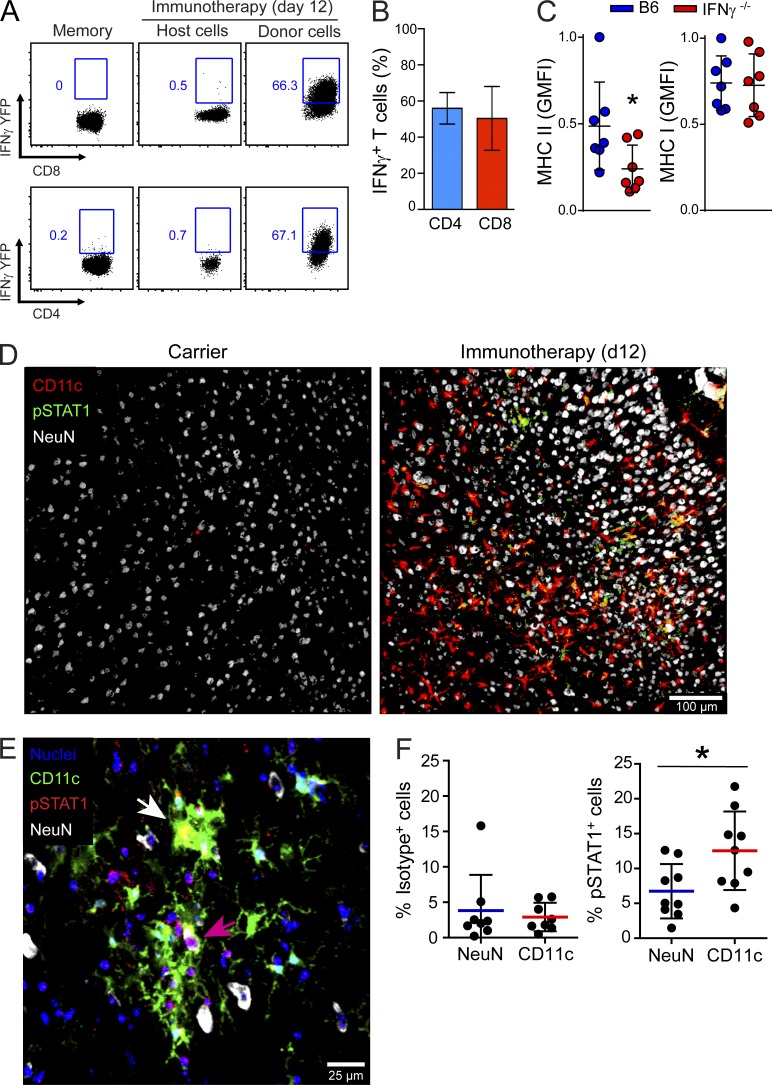
Figure 9.
Antiviral T cells induce IFNγ-dependent signaling in CD11c+ microglia. (A) Representative FACs plots show IFNγ-YFP expression in host versus donor-derived CD8+ and CD4+ T cells extracted from the brain at day 12 after immunotherapy (n = 6 mice per group; three independent experiments). As a control, expression in memory donor cells before transfer into carrier mice is also shown. Blue boxes denote the percentage of YFP-expressing T cells. Gated on CD45+ Thy1.2+ CD8+ or CD4+ cells. (B) The bar graph shows the percentage (mean ± SD) of donor-derived IFNγ-YFP+ CD8+ or CD4+ T cells in the brains of day 12 immunotherapy recipients. (C) Dot plots depict the normalized expression of MHC I and II on CD11c-YFP+ microglia 12 d after administration of memory splenocytes from B6 or IFNγ−/− mice. Microglia were identified as CD45lo/int Thy1.2− Ly6C− Ly6G− CD11b+ CD11c-YFP+ cells. Each dot represents an individual mouse (n = 7 mice per group; three independent experiments; *, P < 0.05), and horizontal black lines denote the mean ± SD of the groups. (D) Representative images show the distribution of CD11c-YFP, pSTAT1, and NeuN in the brain parenchyma of LCMV carrier and day 12 immunotherapy recipients. Note the increased appearance of pSTAT1+ CD11c+ cells (yellow) in the immunotherapy recipients. (E and F) Nuclear pSTAT1 staining was quantified by analyzing the parenchyma of brain tissue sections stained with DAPI (nuclei), CD11c-YFP, NeuN, and pSTAT1 (E). The white arrow denotes a CD11c-YFP+ cell with nuclear pSTAT1 staining (appears yellow). A NeuN+ neuron with nuclear pSTAT1 staining (appears pink) is highlighted by a pink arrow. Dots plots show the frequency of pSTAT1+ neurons or CD11c-YFP+ cells that were positive for nuclear anti-pSTAT1 staining. An isotype control antibody was used to determine background signal. Horizontal lines depict the mean and SD of the groups. Each dot represents the frequency of pSTAT1+ NeuN+ or pSTAT1+ CD11c+ cells per 635-µm2 tissue area within the cerebral cortex (n = 4–5 mice per group; two independent experiments; *, P < 0.05).

