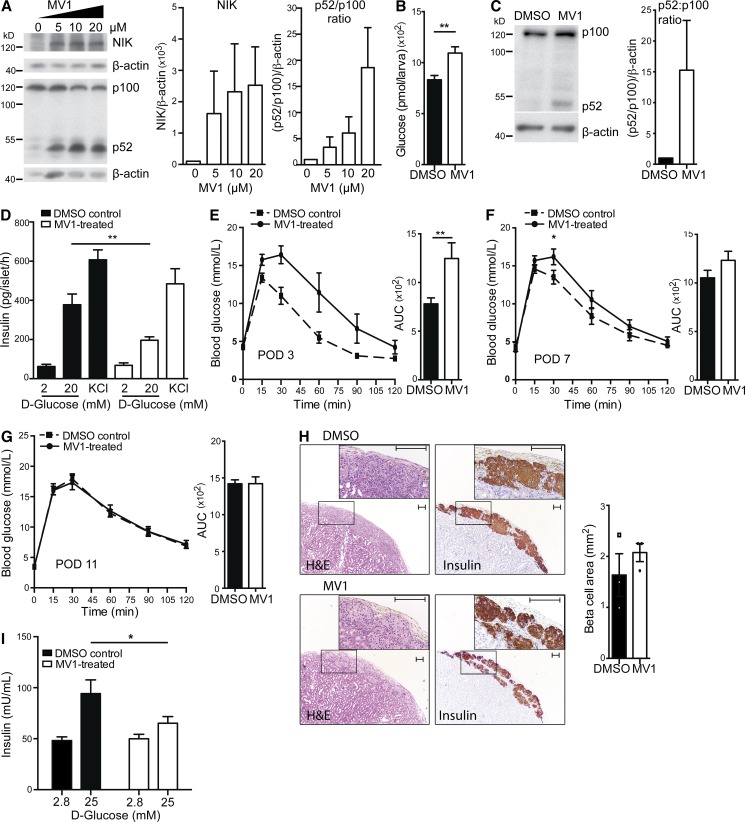
Figure 1.
MV1 disrupts glucose homeostasis in zebrafish and impairs β cell function in human and mouse islets. (A) Protein levels of NIK and p100 to p52 processing in the MDA-MB-231/Luc breast cancer cell line treated with increasing concentrations of MV1 were assessed by immunoblotting. A representative of four independent experiments is shown. Histogram data depicts cumulative densitometry relative to β-actin of the four independent experiments. (B) Glucose levels in zebrafish larvae injected with DMSO or MV1 were assessed. The data are mean and SEM derived from seven control and five MV1-treated groups, with four larvae per group, in a representative of two independent experiments. **, P < 0.01. (C) Protein levels of p100 to p52 processing in DMSO and MV1-treated C57BL/6 mouse islets from one islet isolate were assessed by immunoblotting. A representative of three independent experiments is shown. Histogram data depicts cumulative densitometry relative to β-actin of the three independent experiments. (D) In vitro GSIS in 2 and 20 mM d-glucose and in KCl conditions of DMSO control and MV1-treated primary mouse islets was measured. Data are mean and SEM derived from six independent islet isolates for each group, and are representative of two independent experiments. **, P < 0.01. (E–G) Blood glucose and AUC were determined in DMSO control and MV1-treated mouse islet C57BL/6 transplant recipients after i.p. injection of d-glucose at (E) POD 3 (AUC, **, P < 0.01; control, n = 9; MV1, n = 8), (F) POD 7 (*, P < 0.05; control, n = 12; MV1, n = 13), and (G) POD 11 (n.s.; control, n = 10; MV1, n = 10). Data are representative of three independent mouse cohorts tested. (H) H&E staining and insulin immunostaining of DMSO control and MV1-treated mouse islet grafts are shown. Graft β cell area was determined for three DMSO and three MV1-treated islet grafts by quantification of insulin-positive area in continuous serial graft sections. A representative image for each condition is shown. Boxed insets represent magnified area. Differences in graft area are not significant. *, P > 0.05. Bar, 100 µm. (I) In vitro GSIS in 2.8 and 25 mM d-glucose conditions of DMSO control and MV1-treated primary human islets was measured. Data are mean and SEM derived from quintuplets for DMSO and MV1-treated islets and are representative of three independent human islet isolates. *, P < 0.05. All data are represented as mean ± SEM; p-values were determined using Student’s t test.

