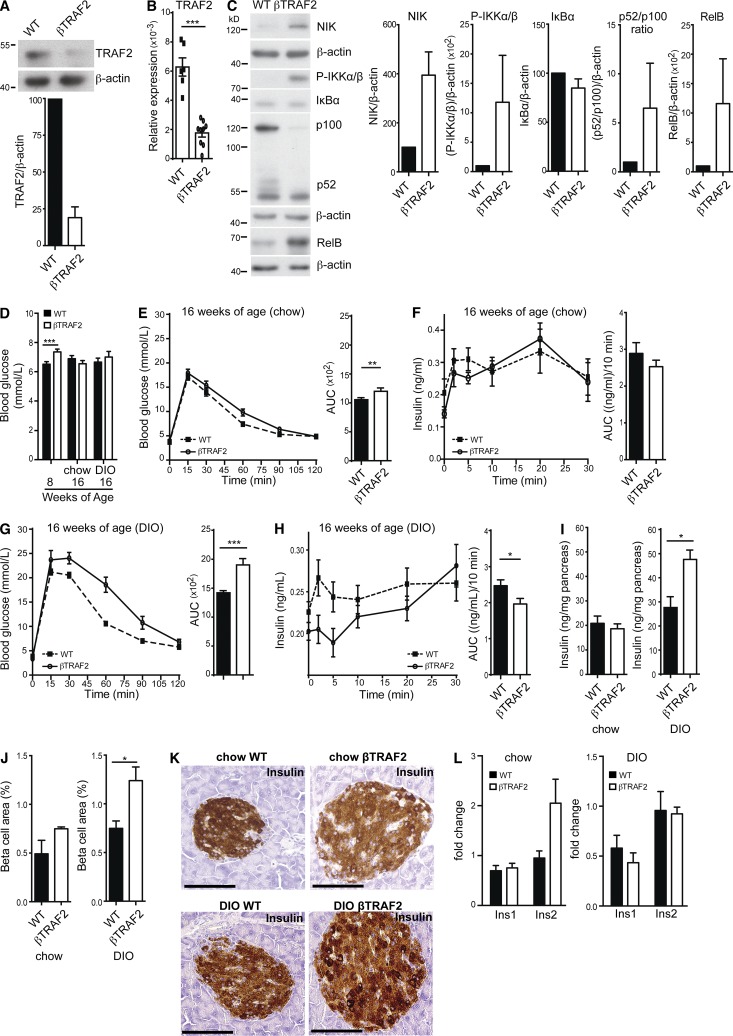
Figure 3.
Constitutive NIK activation elicits a defect in insulin secretion. (A) TRAF2 protein levels in WT and βTRAF2 islets isolated from one WT and one βTRAF2 mouse assessed by immunoblotting. A representative of three independent islet isolates tested per genotype is shown. Histogram data depicts mean and SEM cumulative densitometry data relative to β-actin of the three independent experiments. (B) Relative expression of islet TRAF2 mRNA from six WT and nine βTRAF2 islet isolates was determined by RT-PCR. Data are representative of two independent experiments. ***, P < 0.001. (C) Protein levels of NIK, IKKα/β phosphorylation, IκBα, p100 to p52 processing, and RelB in one nonstimulated WT and one βTRAF2 islet isolate were assessed by immunoblotting. A representative of three independent experiments is shown. Histogram data depicts cumulative densitometry relative to β-actin of the three independent experiments. (D) Non-fasted blood glucose levels were determined in 30 TRAF2loxP/loxP (WT), 10 RI Cre (WT), and 24 βTRAF2 chow-fed mice at 8-wk-old (***, P < 0.001) and in 15 TRAF2loxP/loxP (WT), 5 RI Cre (WT), and 12 βTRAF2 chow-fed mice at 16 wk of age (n.s.) and in 15 TRAF2loxP/loxP (WT), 5 RI Cre (WT), and 12 βTRAF2 HFD-fed mice at 16 wk old (n.s.). Data are representative of three independent mouse cohorts tested. (E) Blood glucose levels were measured in 15 TRAF2loxP/loxP (WT), 5 RI Cre (WT) and 12 βTRAF2 chow-fed mice (16 wk old) after i.p. injection of d-glucose (WT, dotted line; βTRAF2, solid line). Data are representative of three independent mouse cohorts tested. **, P < 0.01. (F) Insulin levels were measured in six TRAF2loxP/loxP (WT) and six βTRAF2 chow-fed mice (16 wk old) after i.v. injection of d-glucose (WT, dotted line; βTRAF2, solid line). Data are representative of three independent mouse cohorts tested (n.s.). (G) Blood glucose levels were measured in 15 TRAF2loxP/loxP (WT), 5 RI Cre (WT), and 12 βTRAF2 HFD-fed mice (16 wk old) after i.p. injection of d-glucose (WT, dotted line; βTRAF2, solid line). Data are representative of three independent mouse cohorts tested. (***, P < 0.001) (H) Insulin levels were measured in 10 TRAF2loxP/loxP (WT), 5 RI Cre, and 10 βTRAF2 HFD-fed mice (16 wk old) after i.v. injection of d-glucose (WT, dotted line; βTRAF2, solid line). Data are representative of three independent mouse cohorts tested. *, P < 0.05. (I) Pancreatic insulin content in chow- and HFD-fed WT and βTRAF2 mice was determined. The data are mean and SEM derived from five mice per group (chow, n.s.; DIO, *, P < 0.05). (J) Total β cell area was determined for chow- and HFD-fed WT and βTRAF2 mice by quantification of insulin-positive area in serial graft sections as a percentage of total pancreatic exocrine tissue. The data are mean and SEM derived from three mice per group (chow, n.s.; DIO, *, P < 0.05). (K) Insulin immunohistochemistry of histological pancreatic sections of chow- and HFD-fed WT and βTRAF2 mice is shown. The data are representative images of three mice per group. Bars, 100 µm. (L) Insulin-1 and Insulin-2 mRNA expression in chow- and HFD-fed TRAF2loxP/loxP (WT) and βTRAF2 from four (Ins1) and five (Ins2) islet isolates was determined by RT-PCR and is presented as a fold change relative to WT (n.s.; data are representative of two independent experiments). All data are represented as mean ± SEM; p-values were determined using Student’s t test.

