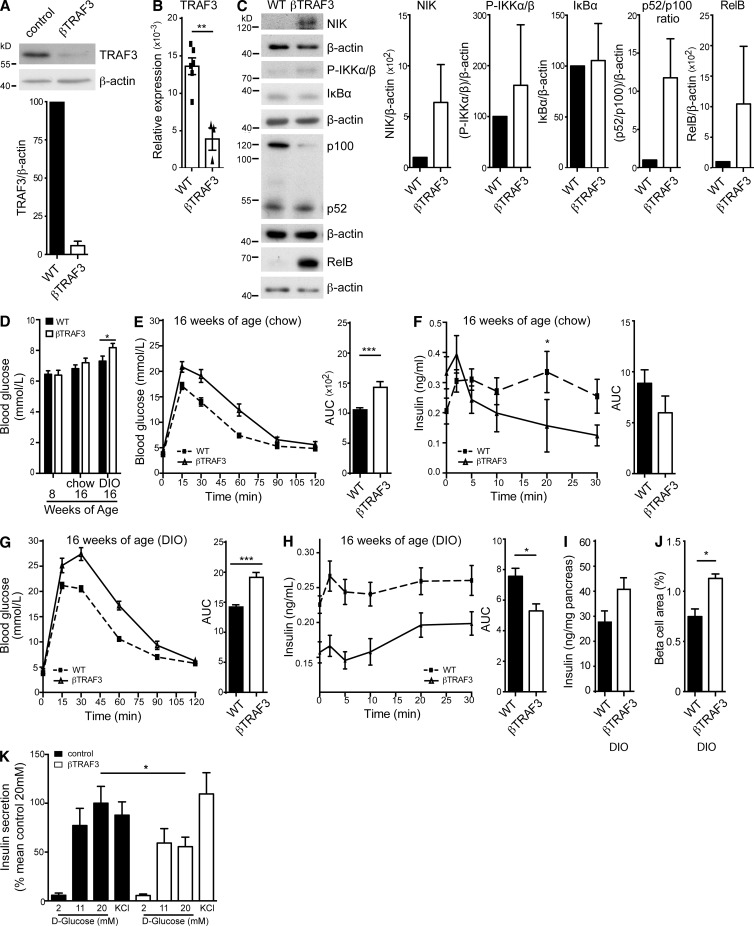
Figure 5.
Destabilization of the TRAF2-TRAF3-BIRC2/3 E3 ligase complex results in impaired β cell function. (A) TRAF3 protein levels in WT and βTRAF3 islets from one WT and one βTRAF3 mouse were assessed by immunoblotting. A representative of three independent islet isolates tested per genotype is shown. Histogram data depict mean and SEM cumulative densitometry relative to β-actin of the three independent experiments. (B) Relative expression of islet TRAF3 mRNA in six WT and three βTRAF3 islet isolates was determined by RT-PCR. Data are representative of two independent experiments. ***, P < 0.001. (C) Protein levels of NIK, IKKα/β phosphorylation, IκBα, p100 to p52 processing, and RelB in one nonstimulated WT and one βTRAF3 islet isolate were assessed by immunoblotting. A representative of three independent experiments is shown. Histogram data depict cumulative densitometry relative to β-actin of the three independent experiments. (D) Non-fasted blood glucose levels were determined in 20 TRAF3loxP/loxP (WT) and 12 βTRAF3 chow-fed mice (8 wk old; n.s.); in 20 TRAF3loxP/loxP (WT) and 10 βTRAF3 chow-fed mice at 16 wk old (n.s.); and in 15 TRAF3loxP/loxP (WT) and 12 βTRAF3 HFD-fed mice (16 wk old). *, P < 0.05. Data are representative of three independent mouse cohorts tested. (E) Blood glucose levels were measured in 20 TRAF3loxP/loxP (WT) and 10 βTRAF3 chow-fed mice (16 wk old) after i.p. injection of d-glucose (WT, dotted line; βTRAF3, solid line). Data are representative of three independent mouse cohorts tested. ***, P < 0.001. (F) Insulin levels were measured in six TRAF3loxP/loxP (WT) and six βTRAF3 chow-fed mice (16 wk old) after i.v. injection of d-glucose (WT: dotted line; βTRAF3: solid line). Data are representative of three independent mouse cohorts tested. *, P < 0.05 at 20 min after injection. (G) Blood glucose levels were measured in 15 TRAF3loxP/loxP (WT), 5 RI Cre (WT) and 12 βTRAF3 chow-fed mice (16 wk old) after i.p. injection of d-glucose (WT, dotted line; βTRAF3, solid line). Data are representative of three independent mouse cohorts tested. ***, P < 0.001. (H) Insulin levels were measured in 10 TRAF3loxP/loxP (WT), 5 RI Cre, and 8 βTRAF3 HFD-fed mice (16 wk old) after i.v. injection of d-glucose (WT, dotted line; βTRAF3, solid line). Data are representative of three independent mouse cohorts tested. *, P < 0.05. (I) Pancreatic insulin content in HFD-fed WT and βTRAF3 mice was determined. The data are mean and SEM derived from five mice per group (n.s.; P = 0.072). (J) Total β cell area was determined for HFD-fed WT and βTRAF3 mice by quantification of insulin-positive area in serial graft sections as a percentage of total pancreatic exocrine tissue. The data are mean and SEM derived from three mice per group. *, P < 0.05. (K) In vitro GSIS in 2, 11, and 20 mM d-glucose. KCl conditions in WT and βTRAF3 mouse islets were measured. Data are mean and SEM derived from six independent islet isolates for each group and are representative of two independent experiments. *, P < 0.05. All data are represented as mean ± SEM; p-values were determined using Student’s t test.

