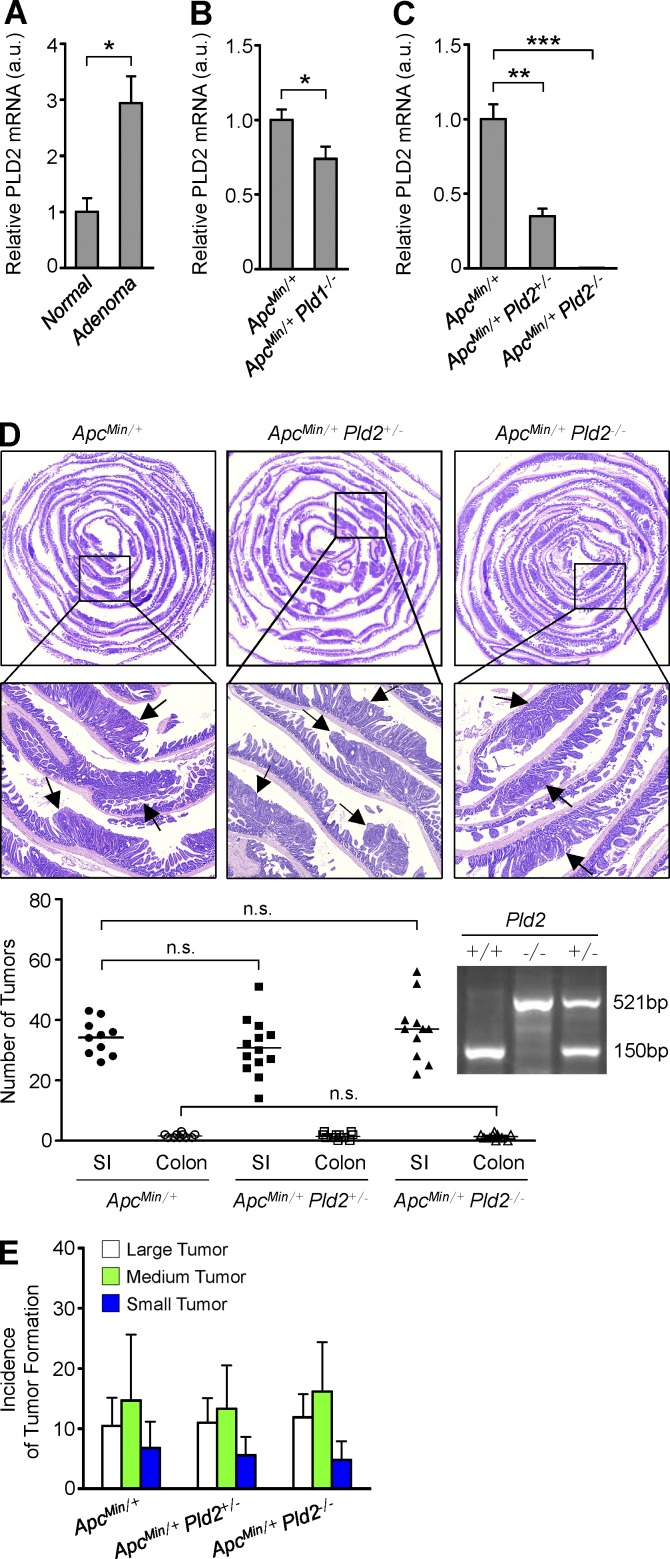
Figure 2.
PLD2 ablation does not reduce intestinal tumorigenesis in ApcMin/+ mice. (A) q-RT-PCR analysis of PLD2 in normal SI of WT mice or adenomas of Apcmin/+ mice. Results are representative of three independent experiments and are shown as mean ± SEM. n = 8 per group. Student’s t test was used. (B) q-RT-PCR analysis of PLD2 in tumor tissues of ApcMin/+ (n = 7) and ApcMin/+Pld1−/− (n = 12) mice, which were sacrificed at 16 wk. Results are representative of three independent experiments and are shown as mean ± SEM. Student’s t test was used. (C) q-RT-PCR analysis of PLD2 in normal SI tissues of ApcMin/+, ApcMin/+Pld2+/−, and ApcMin/+Pld2−/− mice, which were sacrificed at 12 wk (mean ± SEM). n = 7 per group. Student’s t test was used. (D and E) ApcMin/+ (n = 10), ApcMin/+Pld2+/− (n = 13), and ApcMin/+Pld2−/− (n = 11) mice were sacrificed at 16 wk. (D) Arrows indicate polyps. H&E staining of the entire SI Swiss roll (top). The number of visible polyps in the SI and colon intestine (bottom). n.s., not significant. (E) Size distribution of polyps in the SI of the indicated mice. Results are representative of at least two independent experiments. *, P < 0.05; **, P < 0.01; ***, P < 0.001. a.u., arbitrary units.

