Figure 3.
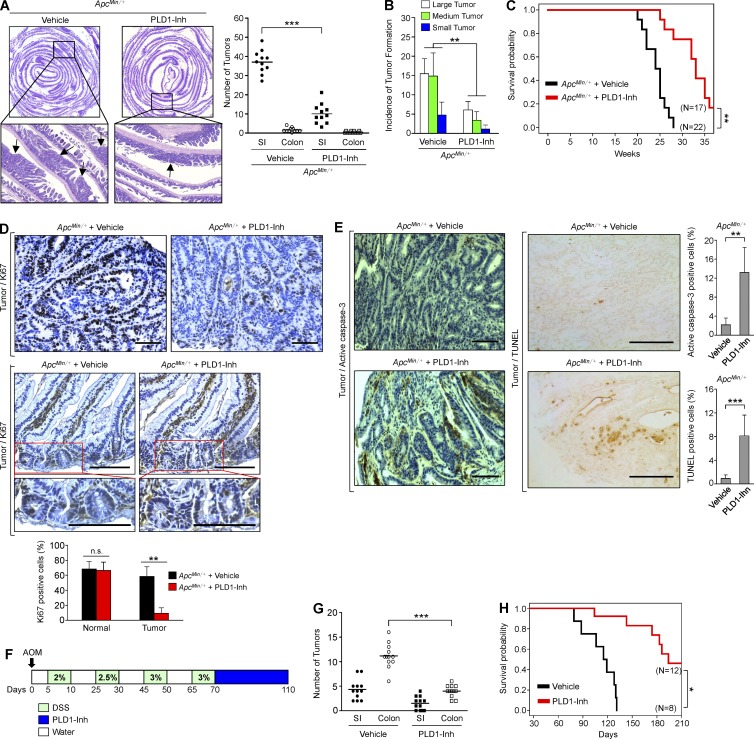
PLD1 inhibition attenuates intestinal tumorigenesis in the ApcMin/+ and AOM/DSS mice model. (A and B) 12-wk-old male ApcMin/+ mice were treated i.p. with either vehicle or 10 mg/kg PLD1 inhibitor three times a week for 4 wk. ApcMin/+/vehicle (n = 11) and ApcMin/+/PLD1-Inh (n = 11) mice were sacrificed at 16 wk. (A) Arrows indicate polyps. H&E staining of representative whole SI Swiss roll (left). The number of visible polyps in the SI and colon intestine (right). Student’s t test was used. (B) Size distribution of polyps in the SI of the indicated mice. Results are representative of at least two independent experiments. ANOVA F-test was used. (C) The indicated mice were followed for long-term survival. Survival probability was analyzed using Kaplan-Meier, and differences were evaluated using the log-rank test. (D) IHC for Ki67 in tumor tissues (top) and normal mucosa (middle) of vehicle or PLD1 inhibitor–treated ApcMin/+ mice. Representative images were selected from at least six different fields. The expression of Ki67 in the tumor was quantified (bottom). Results are representative of three independent experiments and are shown as mean ± SEM. n = 6 per group; five tumors per mouse. n.s., not significant. (E) IHC for active caspase-3 (left) and TUNEL assay (middle) in tumor tissues of ApcMin/+ and ApcMin/+Pld1−/− mice. The levels of caspase-3– and TUNEL-positive cells were quantified (right). Results are representative of at least two independent experiments and are shown as mean ± SEM. n = 6 per group; five tumors per mouse. IHC staining results were analyzed using the Chi-square test. (F) AOM/DSS-induced mice were treated i.p. with either vehicle or 10 mg/kg PLD1 inhibitor three times a week for 6 wk and AOM/DSS-vehicle (n = 12), or AOM/DSS–PLD1-Inh (n = 12) mice were sacrificed at 110 d. (G) The number of visible polyps in the SI and colon intestine. Student’s t test was used. (H) The indicated mice were followed for long-term survival. Survival probability was analyzed using Kaplan-Meier, and differences were evaluated using the log-rank test. *, P < 0.05; **, P < 0.01; ***, P < 0.001. Bars, 100 µm.

