Figure 5.
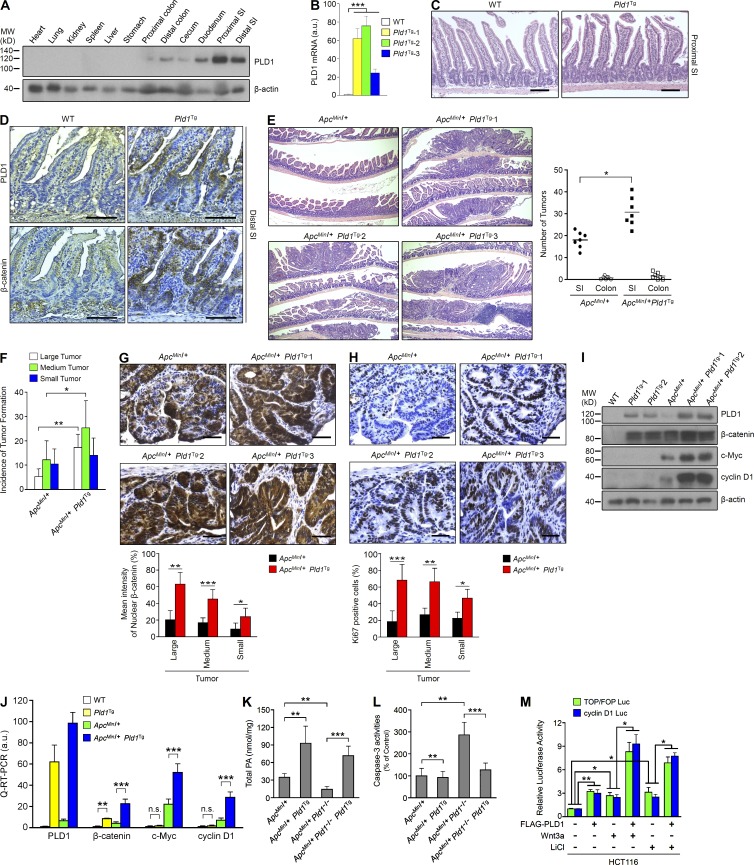
IEC-specific PLD1 overexpression accelerates tumorigenesis in ApcMin/+ mice. (A) PLD1 expression in various tissues from IEC-specific PLD1Tg mice. Results are representative of at least four independent experiments. (B) q-RT-PCR analysis in SI from WT and Pld1Tg mice. n = 5 per group. (C and D) WT (n = 5) and Pld1Tg (n = 6) mice were sacrificed at 12 weeks for histology analysis. H&E staining (C) and IHC for PLD1 and β-catenin (D). (E) The histology of representative tumors (left) and incidence of tumor formation (right; n = 7 per group). (B–D) A Student’s t test was used. (F) Size distribution of polyps in the SI of the indicated mice. n = 7 per group. ANOVA F-test was used. (G and H) IHC for β-catenin (G) and Ki67 (H). Representative images were selected from at least three different fields. The expressions of nuclear β-catenin (G) and Ki67 (H) were quantified in size distribution of polyps. n = 5 per group; 10 tumors per mouse. A Chi-square test was used. (I) IB analysis from tissues of the indicated mice. (J) q-RT-PCR analysis from the indicated mice. n = 3–7 per group. (K and L) Total PA levels (K) and caspase-3 activities (L) in lysates from tumor tissues of ApcMin/+ (n = 7), ApcMin/+Pld1Tg (n = 5), ApcMin/+Pld1−/− (n = 9), and ApcMin/+Pld1−/−Pld1Tg (n = 12) mice sacrificed at 18 wk. Results are representative of three independent experiments. (M) Effect of PLD1 and/or Wnt3a (mimics; LiCl) on TCF trans-activation and cyclin D1 promoter activity. (J–M) A Student’s t test was used. All data are shown as mean ± SEM. *, P < 0.05; **, P < 0.01; ***, P < 0.001. n.s., not significant; MW, molecular weight; a.u., arbitrary units. Bars, 100 µm.

