Figure 7.
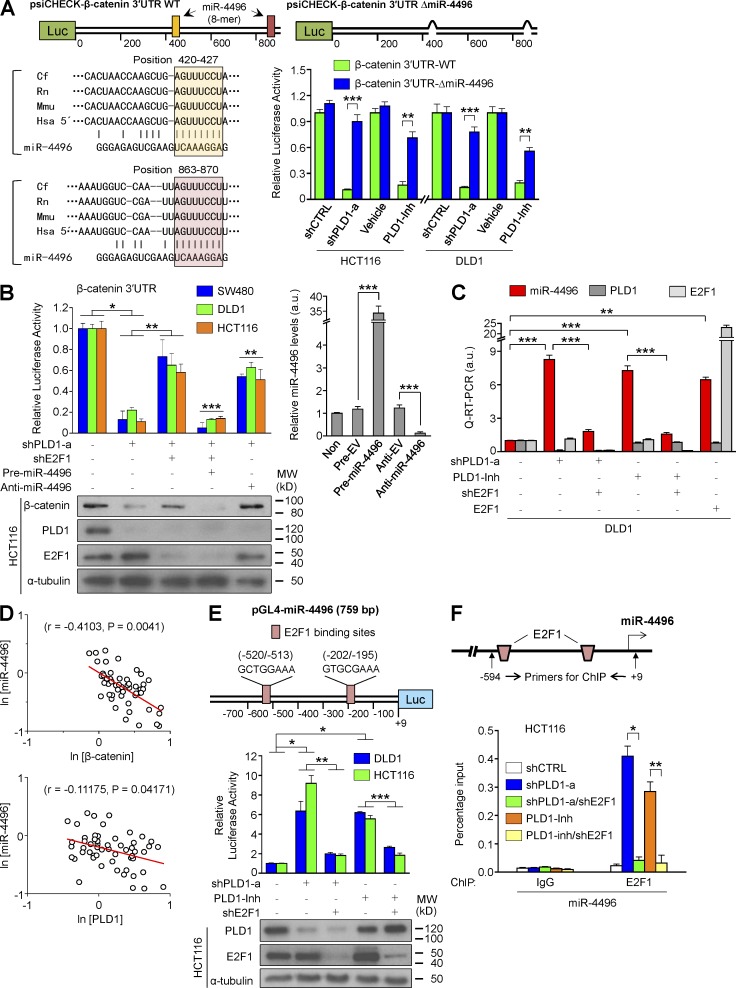
PLD1 inhibition down-regulates β-catenin expression through E2F1-induced miR-4496 up-regulation. (A) Schematic representation of luciferase constructs of β-catenin 3′ UTR. Luciferase vectors (psiCHECK) were inserted with full-length β-catenin 3′ UTR (930 bp). ΔmiR-4496 (914 bp) were generated by deletions of highly conserved and predicted binding sites for the seed sequences of the miR. Effect of depletion or inhibition of PLD1 on the luciferase activity of β-catenin 3′ UTR reporters. A Student’s t test was used. The pink and peach boxes represent conserved seed pairing. (B) Effect of the pre- and anti-miR on PLD1 or E2F1-mediated β-catenin 3′ UTR luciferase activity and IB analysis of β-catenin (left). The levels of pre- and anti-miR are shown as a control (right). ANOVA F-test was used. (C) q-RT-PCR analysis of miR-4496 under the indicated conditions. A Student’s t test was used. (D) Inverse correlation of β-catenin or PLD1 with miR-4496 mRNA levels in CRC tissues. Spearman’s correlation coefficient (r) is provided with its statistical significance. The red lines represent the best-fit curves. (E) Schematic view of two putative E2F1 binding elements in promoter regions of the human miR-4496 (top). Effect of PLD1 and E2F1 on promoter activity of miR-4496 (middle). IB analysis of PLD1 and E2F1 is shown as a control (bottom). (F) ChIP assays for the binding of E2F1 to the promoter of miR-4496. (E and F) Results are representative of at least three independent experiments and are shown as mean ± SEM. A Student’s t test was used. *, P < 0.05; **, P < 0.01; ***, P < 0.001. MW, molecular weight; a.u., arbitrary units.

