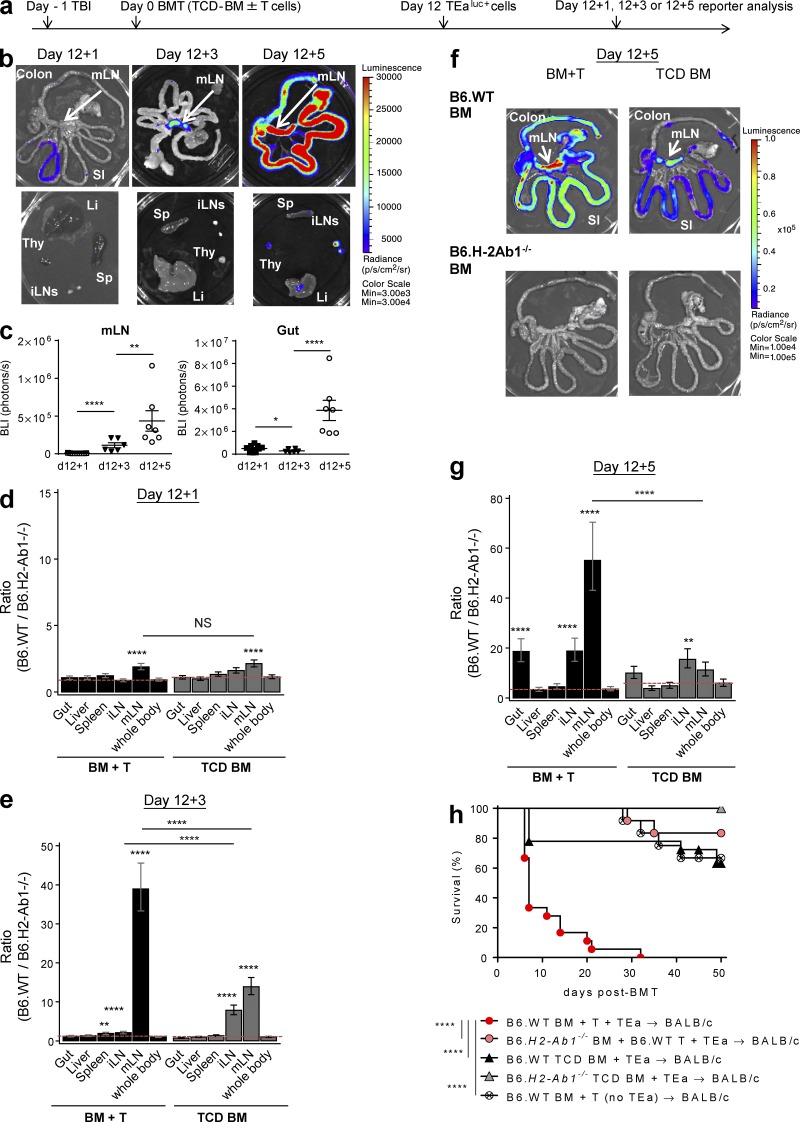
Figure 1.
Donor alloantigen presentation during GVHD drives T cell accumulation and expansion in the mLNs. BALB/c mice were transplanted with TCD BM from B6.WT or B6.H2-Ab1−/− mice, with or without B6.WT T cells (“BM + T” or “TCD BM”). On day 12 TEaluc+ cells were injected, and 1, 3, or 5 d later BLI signals were quantified. (a) Experimental schema. (b and c) Representative images (b) and quantification (c) of BLI signals in mLNs and gut from the recipients of BM + T. Data shown are combined from three replicate experiments (n = 9, 6, and 7 per time point). ****, P < 0.0001; **, P = 0.0032; *, P = 0.035. Li, liver; SI, small intestine; Sp, spleen; Thy, thymus. (d–g) Ratio of BLI signals from the recipients of B6.WT BM to those from the recipients of B6.H2-Ab1−/− BM 1 (d), 3 (e), and 5 d (g) after TEaluc+ cell injection by mixed-model analysis and representative images on day 12 + 5 (f). ****, P < 0.0001; **, P = 0.001 (day 12 + 3, BM + T); **, P = 0.004 (day 12 + 5, TCD BM) versus whole body (d, e, and g), except BM + T versus TCD BM for mLNs or iLNs, P = 0.51 (d) and ****, P < 0.0001 (g and e). Data shown are combined from two replicate experiments, respectively (n = 10 [d], 7–12 [e], and 7–11 [g] per group). (h) BALB/c mice were transplanted with TCD BM from B6.WT or B6.H2-Ab1−/− mice with or without B6.WT T cells and/or TEaluc+ cells on day 0. GVHD survival is combined from three replicate experiments (n = 18 per group in groups of B6.WT BM with TEa and 12 in the other groups). ****, P < 0.0001 as indicated. Data are represented as mean ± SEM.

