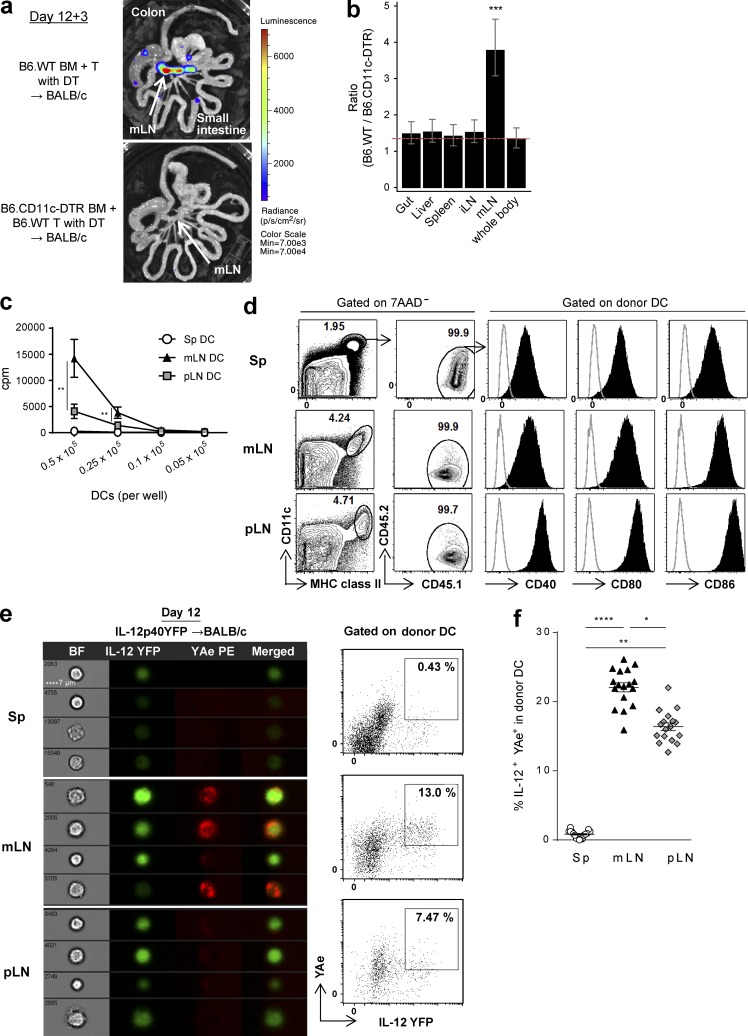
Figure 3.
Alloantigen is preferentially presented by donor DCs in the mLNs during GVHD. (a and b) BALB/c mice were transplanted with TCD BM from B6.WT or B6.CD11c.DTR mice and B6.WT T cells, followed by DT administration. TEaluc+ cells injected on day 12 were quantified 3 d later. (a) Representative images. (b) The ratio of BLI signals from donor DC-replete mice to those from DC-deleted mice by mixed-model analysis are combined from two replicate experiments (n = 9 per group). ***, P = 0.00016 versus whole body. (c) Proliferation of TEa cells stimulated with DCs isolated at day 12 from BALB/c recipient mice transplanted with BM and T cells from B6.WT mice, as determined by [3H]thymidine uptake. **, P = 0.0020 (DC; 5 × 10⁴) or 0.0065 (DC; 2.5 × 10⁴); mLN versus pLN. ****, P < 0.0001 (DC; 5 × 10⁴, 2.5 × 10⁴); mLN versus spleen (Sp). (d) Representative FACS plots at day 12 after BMT of BALB/c (CD45.2+) recipients receiving BM and T cells from B6.CD45.1+ mice. (c and d) Data are representative of two replicate experiments. (e and f) BALB/c mice (I-Ad+) were transplanted with BM and T cells from B6.IL-12p40YFP mice. Donor DCs (IA/IE+CD11c+I-Ad−7AAD−) from spleen, mLNs, and pLNs were FACS sorted (e) or unsorted (f) on day 12. (e) Representative pictures (left) and quantification (right) of imaging flow cytometry for IL-12p40YFP and YAe are shown from three replicate experiments. (f) The frequency of YFP+YAe+ cells in the IA/IE+CD11c+I-Ad−7AAD− population was quantified by conventional flow cytometry. Data shown are combined from three replicate experiments (n = 17). ****, P < 0.0001; **, P = 0.0011; *, P = 0.0118. Data are represented as mean ± SEM.

