Figure 4.
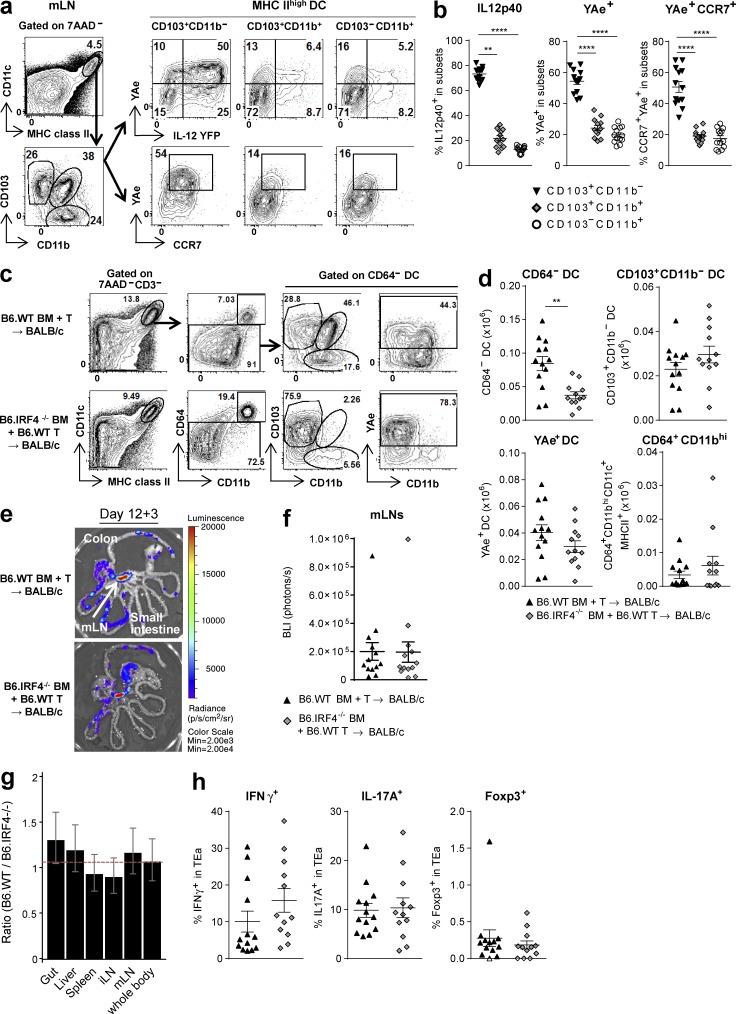
The mLN CD103+CD11b− DC subset presents alloantigen and secretes IL-12. (a and b) BALB/c mice were transplanted with BM and T cells from B6.IL-12p40-YFP mice. mLNs were isolated on day 12. Representative FACS plots (a) and quantification (b) of YFP, YAe, or CCR7 expression on DC subsets discriminated by CD103 and CD11b expression. Data shown are combined from two replicate experiments (n = 13). ****, P < 0.0001; **, P = 0.0031. (c–h) BALB/c mice were transplanted with TCD BM from B6.WT or B6.IRF4−/− mice and B6.WT T cells. On day 12 TEaluc+ cells were injected, and 3 d later DC subsets and TEa expansion were analyzed. (c and d) Representative FACS plots (c) and absolute numbers of CD64− DCs, CD103+CD11b− DCs, YAe+CD64− DCs, and CD64+CD11bhiCD11c+MHC class II+ cells in mLNs (d) are shown. **, P = 0.0011; P = 0.1979 (CD103+CD11b− DC), P = 0.1900 (YAe+ DC), P = 0.28 (CD64+CD11bhi). (e and f) Representative images (e) and quantification (f) of BLI signals. P = 0.8310. (g) Ratio of BLI signals from B6.WT BM recipients to those from B6.IRF4−/− BM recipients by mixed-model analysis. (h) Frequency of IFN-γ, IL-17A, and Foxp3 expression gated on TEa cells detected as Vβ6+Vα2+CD45.1+ cells. P = 0.1283 (IFN-γ), P = 0.8343 (IL-17A), P = 0.4597 (Foxp3). (c–h) Data shown are combined from two replicate experiments (n = 13 per group). Data are represented as mean ± SEM.

