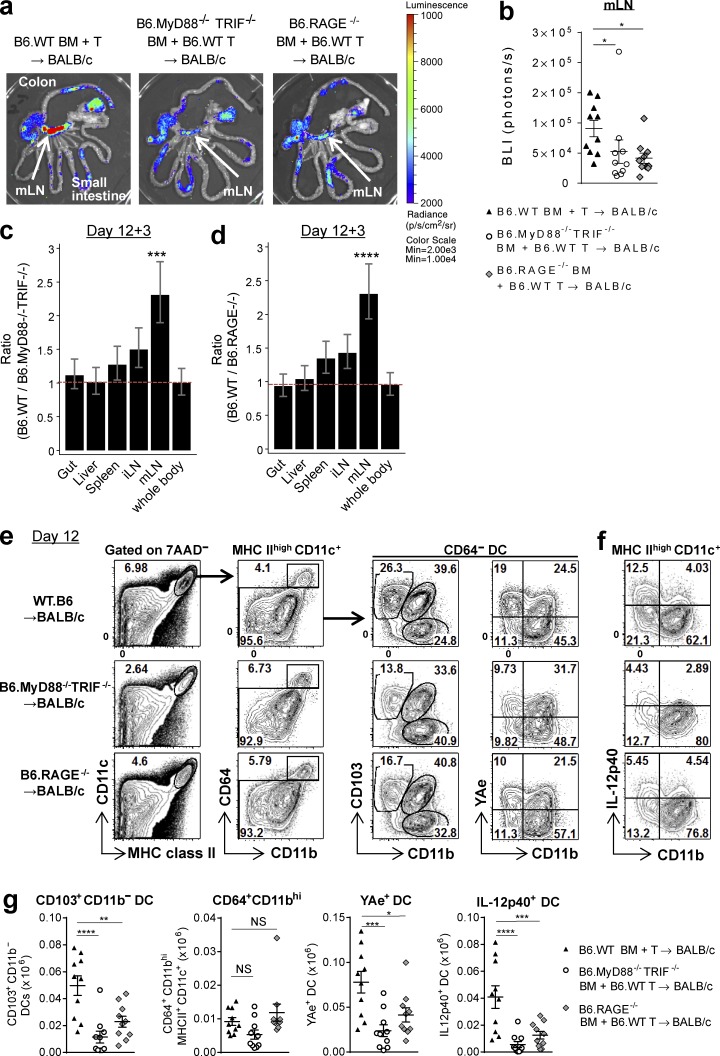
Figure 6.
DAMP/PAMP signals drive alloantigen presentation by the donor CD103+CD11b− DC subset within the mLNs. BALB/c mice were transplanted with TCD BM from B6.WT, B6.MyD88−/−TRIF−/−, or B6.RAGE−/− mice with B6.WT T cells. (a–d) On day 12 TEaluc+ T cells were injected, and 3 d later BLI signals were measured. Representative image (a), quantification of BLI signals in mLNs (b), and ratio of BLI signals from B6.WT BM recipients to those from B6.MyD88−/−TRIF−/− (c) or B6.RAGE−/− (d) BM recipients by mixed-model analysis. Data shown are combined from two replicate experiments (n = 10 per group). *, P = 0.0186, B6.WT BM versus B6.MyD88−/−TRIF−/− BM; *, P = 0.0187, B6.WT BM versus B6.RAGE−/− BM (b). ***, P = 0.00027 (c); ****, P < 0.0001 (d), mLN versus whole body. (e–g) mLNs were isolated on day 12. Representative FACS plots (e and f) and absolute numbers of CD103+CD11b− DC, YAe+ DC, IL-12p40+ DC, and CD64+CD11bhi macrophages in the mLNs (g). Data shown are combined from two replicate experiments (n = 10 per group). ****, P < 0.0001; **, P = 0.0025; *, P = 0.0131. ***, P = 0.0004, B6.WT BM versus B6.MyD88−/−TRIF−/− BM (YAe+ DC); ***, P = 0.0001, B6.WT BM versus B6.RAGE−/− BM (IL-12p40+DC (g). Data are represented as mean ± SEM.

