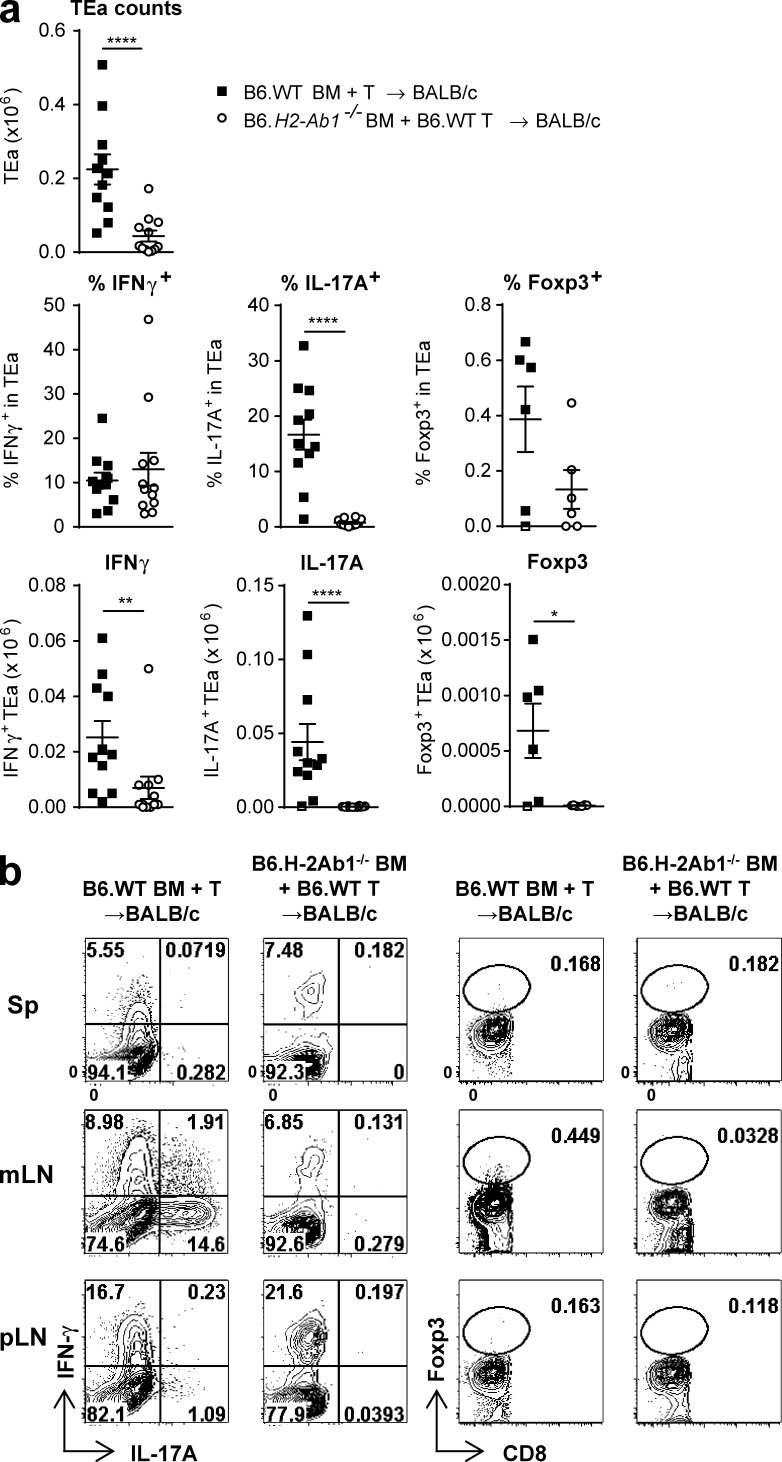
Figure 8.
T cell expansion and differentiation are dependent on indirect antigen presentation. BALB/c mice were transplanted with TCD BM from B6.WT or B6.H2-Ab1−/− mice and B6.WT T cells. On day 12 TEa T cells were injected, and 3 d later TEa cells from spleen (Sp), mLNs, and pLNs were quantified. (a) Quantification of absolute number of TEa cells (Vb6+Va2+CD8−CD90.2+) and frequency and absolute numbers of IFN-γ–, IL-17A–, and Foxp3-expressing TEa cells in mLNs. (b) Representative FACS plots. Data shown are combined from two replicate experiments (n = 11–12 per group for TEa counts, IFN-γ, and IL-17A; n = 6 per group for Foxp3). ****, P < 0.0001; **, P = 0.0032; *, P = 0.041. Data are represented as mean ± SEM.

