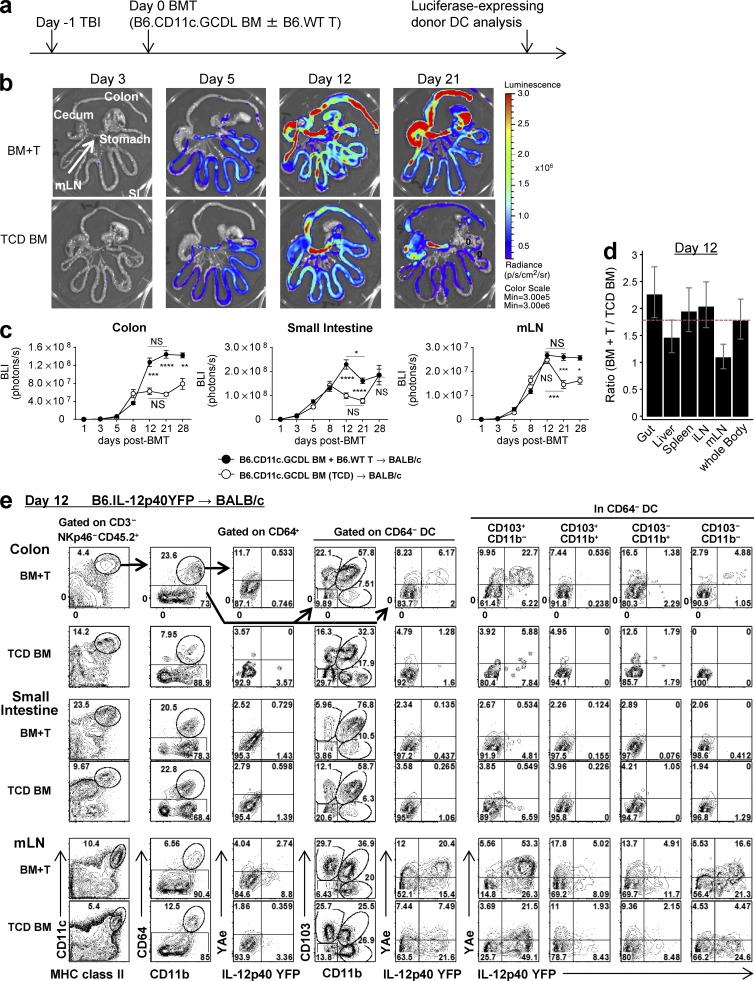
Figure 9.
Donor DCs presenting alloantigen expand in the colon during GVHD. (a–d) BALB/c mice were transplanted with TCD BM from B6.CD11c.GCDL mice (where luciferase is driven off the CD11c promoter) with or without B6.WT T cells, and BLI signals were quantified thereafter (to determine donor DC expansion). Experimental schema (a), representative BLI on days 3, 5, 12, and 21 (b), quantified BLI signals in colon, small intestine, and mLNs (c), and ratio of BLI signals from mice receiving BM and B6.WT T cells to those from mice receiving TCD BM alone on day 12 by mixed-model analysis (d). Time course shown in c is combined from three experiments (n = 3–9 per time point). Data on days 5, 8, 12, and 21 are combined from two replicate experiments. *, P = 0.0499, day 12 versus day 21 of BM + T in small intestine; ***, P = 0.002, day 12 versus day 21 of TCD BM in mLN; BM + T versus TCD BM ****, P < 0.0001 (day 21); ***, P = 0.0009 (day 12); **, P = 0.0093 (day 28) in colon; ****, P < 0.0001 (days 12 and 21) in small intestine; ***, P = 0.0006 (day 21); *, P = 0.0257 (day 28) in mLNs. (e) BALB/c mice were transplanted with TCD BM with or without T cells from B6.IL-12p40-YFP (CD45.2+) mice. Representative FACS plots of the CD3−NKp46−CD45.2+ fraction from the isolated colon, small intestine, and mLNs on day 12 are shown and are representative of two replicate experiments. Data are represented as mean ± SEM.

