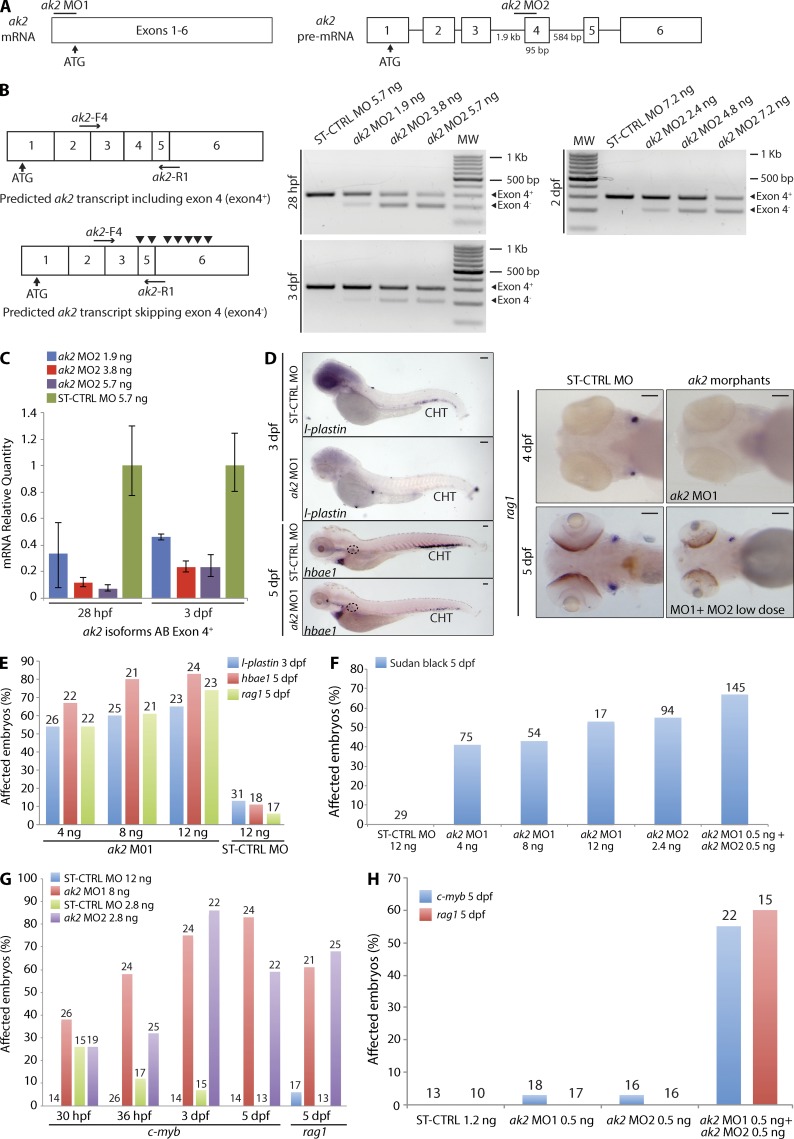
Figure 3.
ak2 knockdown by MO injection phenocopies hematopoietic defects observed in ak2 zebrafish mutants. (A) Schematic representation of the two different MOs used in the study: ak2 MO1 blocking the mRNA translation and ak2 MO2 targeting the intron 3–exon 4 splice junction of the ak2 gene. Neither exons nor introns are drawn to scale. Numbers below the introns (straight lines) and exons (white boxes) indicate their size in bases. (B) Schematic representation of the predicted AK2 transcripts in MO-treated embryos. Black arrowheads in the bottom left panel indicate noncanonical STOP codons introduced by ak2 MO2–induced skipping of exon 4. Horizontal black arrows indicate the pair of primers used in RT-PCR (right panels) to test the effects of different doses of ak2 MO2 during development as indicated. MW, molecular weight size marker. (C) mRNA quantitative real-time PCR analysis of splicing MO activity (three different doses) at 28 hpf and 3 dpf. In both cases, ST-CTRL MO–injected embryos serve as reference. The error bars indicate the calculated maximum (RQmax) and minimum (RQmin) expression levels that represent the standard error of the mean expression levels (RQ value). (D–H) Qualitative and quantitative analysis of hematopoietic defects induced by ak2 MOs injection during definitive hematopoiesis assessed by WISH and stereomicroscopy. WT Ekkwill (EK) embryos were injected with different doses (4, 8, and 12 ng) of ak2 MO1 or ak2 MO2 (2.4 ng) and analyzed by WISH at different developmental stages using specific hematopoietic probes. ST-CTRL MO at the highest dose used for ak2 MO1 was used as a control. Numbers above bars indicate the total count of embryos analyzed. (D, left) Stereomicroscope lateral views of l-plastin (marker of macrophages and monocytes) and hbae1 WISH signals in ST-CTRL and ak2 MO1 morphants at 3 and 5 dpf. Black dashed circles indicate the position of the kidney. (right) Stereomicroscope ventral views of ST-CTRL MO, ak2 MO1 morphants, or ak2 MO1- and MO2-coinjected embryos hybridized with rag1 ISH probe to visualize differentiating lymphocytes in the thymus. For each sample, at least 25 embryos have been analyzed. Bars, 100 µm. (E) Effect of ak2 MO1 and ST-CTRL MO injection on the expression of l-plastin, hbae1, and rag1. (F) Effect of single ak2 MO injection and low dose coinjection on granulopoiesis (Sudan black stain). (G and H) Effect of single ak2 MO injection or low dose coinjection on the expression of c-myb and rag1 from 30 hpf to 5 dpf.. Data are presented as percentage of affected embryos. All data (B–H) show one representative experiment out of at least two independently performed.

