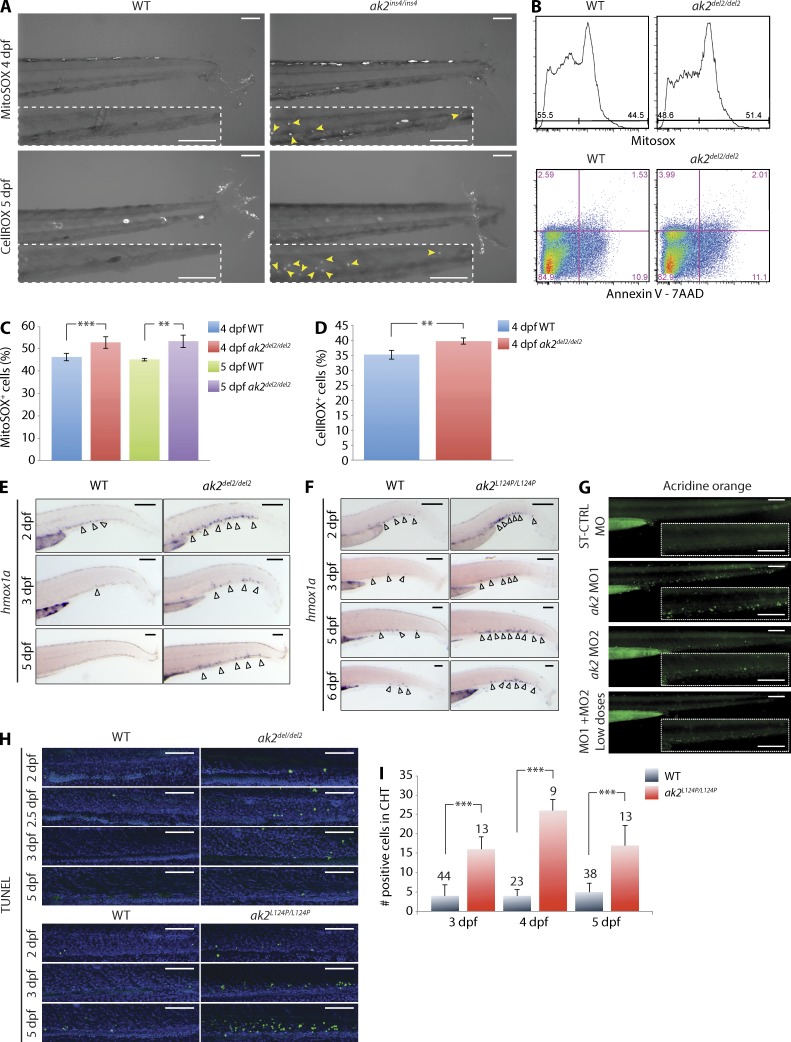
Figure 5.
AK2 mutant zebrafish demonstrate increased levels of cellular oxidative stress and apoptosis in hematopoietic tissues. (A) Confocal microscopy assessment of oxidative stress in the CHT region of WT and ak2ins4/ins4 mutant embryos probed with the MitoSOX or CellROX indicators at the indicated stages. Yellow arrowheads in the dashed insets indicate MitoSOX- or CellROX-positive cells in CHT regions. (B) Representative quantitative analysis by flow cytometry of oxidative stress, apoptosis, and cell death on 5 dpf ak2del2/del2 and control embryos (60 embryos each) using MitoSOX Red and Annexin V + 7-AAD, respectively. (C and D) Quantitative analysis of MitoSOX Red (C) and CellROX Green (D) staining at 4 and 5 dpf in ak2del2/del2 mutants and WT siblings (60 embryos each). (E) WISH analysis of hmox1a expression in ak2del2/del2 mutants and their WT siblings at different stages of development. (F) WISH analysis of hmox1a expression in ak2L124P/L124P mutants and their WT siblings at different stages of development. (E and F) Open arrowheads indicate hmox1a-positive cells. (G) Stereomicroscope analysis of acridine orange staining of AK2 morphants at 3 dpf. Dashed insets show CHT regions. (H) Confocal analysis of fluorescent TUNEL staining in CHT regions of WT siblings and ak2del2/del2 and ak2L124P/L124P mutant embryos from 2 to 5 dpf. Each panel represents a crop of the CHT region from a 14× magnification image. The green signal indicates TUNEL-positive cells and the blue signal indicates DAPI staining. (A and E–H) For each sample, at least 25 embryos have been analyzed. Bars, 100 µm. (I) Quantitative analysis of TUNEL AP staining on WT siblings and ak2L124P/L124P missense mutant embryos from 3 to 5 dpf. The number of embryos analyzed is shown above each column. In panels C, D, and I, error bars indicate standard deviation; **, P < 0.01; ***, P < 0.001 for the indicated comparisons using an unpaired Student’s t test. Data in C and D are pooled from at least three independent experiments. Data in A, B, and E–I are representative of at least two independent experiments.

