Figure 8.
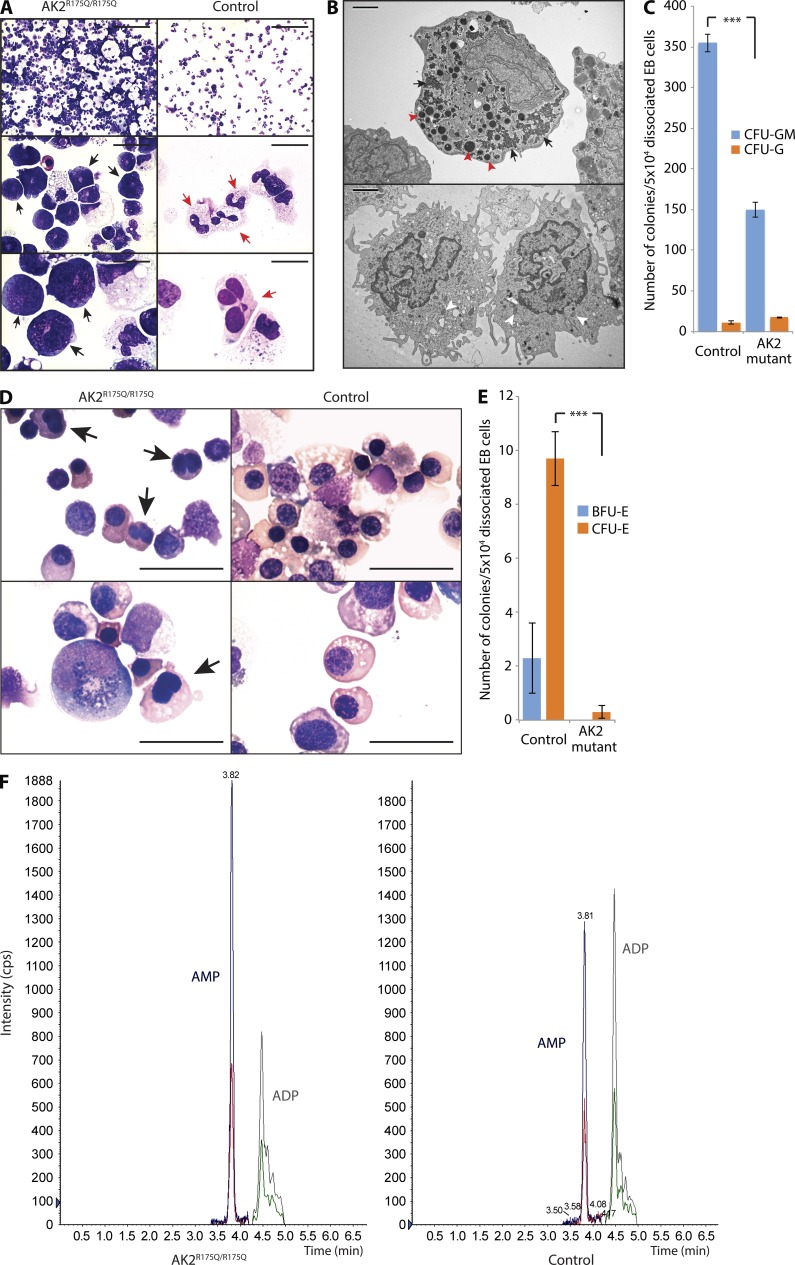
AK2 deficiency affects in vitro granulopoiesis, erythropoiesis, and the adenine nucleotide profile of human myeloid cells. (A) Microscopic analysis of in vitro myeloid differentiation of AK2R175Q/R175Q and control iPSCs; black arrows indicate promyelocytes; red arrows indicate mature neutrophils. (B) Electron microscopy assessment of AK2R175Q/R175Q iPSC-derived myeloid precursors and control cells. Red arrowheads mark large electron-dense primary granules, and black arrows indicate glycogen storage in the cytoplasm (top). White arrowheads highlight pale secondary granules (bottom). (C) The number of myeloid colonies grown from 50k dissociated EB cells after 14 d of culture on methylcellulose was assessed (***, P < 0.001, χ2 test). Data represent the mean of three experiments, and error bars depict standard error. (D) In vitro erythroid differentiation of AK2R175Q/R175Q and control iPSCs was assessed by microscopy. Black arrows indicate incomplete nuclear separation. (A, B, and D) Data are representative of at least three independent experiments. Bars: (A, top) 100 µm; (A, middle) 20 µm; (A and D, bottom) 10 µm; (B) 2 µm; (D, top) 25 µm. (E) Number of red blood cell–forming colonies (BFU-E and CFU-E) grown from 50k dissociated EB cells after 14 d of culture on methylcellulose (***, P < 0.003, χ2 test). Data represent the mean of three independent experiments, and error bars depict standard error. (F) Quantification of cellular AMP and ADP content in AK2R175Q/R175Q iPSC-derived myeloid cells and control myeloid cells by tandem mass spectrometry. Data are representative of three independent experiments. iPSCs generated from a human foreskin fibroblast line were used as WT control in all experiments (A–F).

