FIGURE 3.

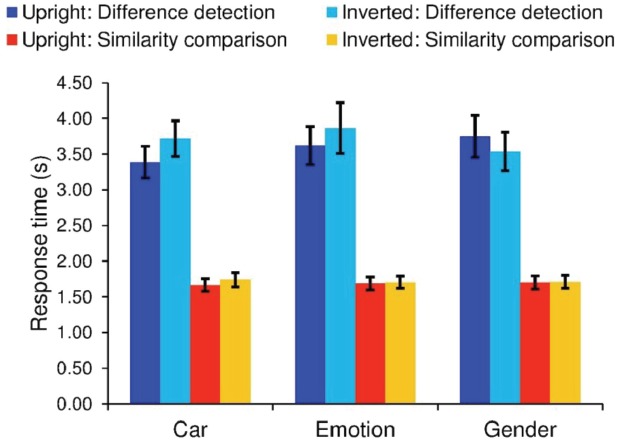
N = 19. Error bars denote ± the standard error of the mean. Mean response times for correct responses for the difference detection and similarity comparison tasks.

N = 19. Error bars denote ± the standard error of the mean. Mean response times for correct responses for the difference detection and similarity comparison tasks.