Figure 1.

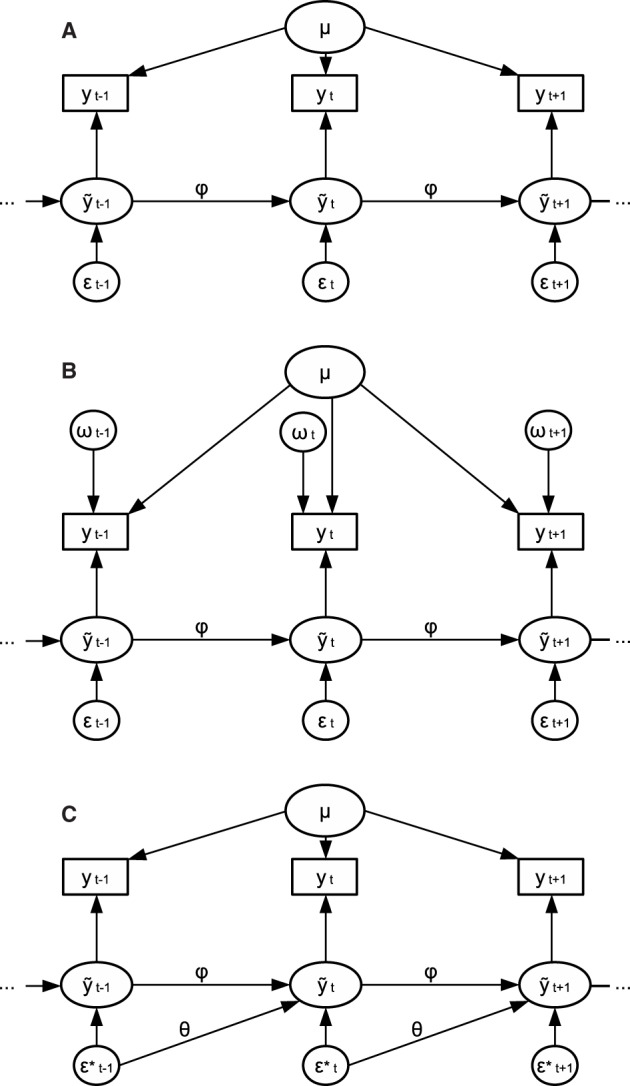
(A) Graphical representation of an AR(1) model. (B) Graphical representation of an AR(1)+WN model. (C) Graphical representation of an ARMA(1,1) model.

(A) Graphical representation of an AR(1) model. (B) Graphical representation of an AR(1)+WN model. (C) Graphical representation of an ARMA(1,1) model.