Figure 1.

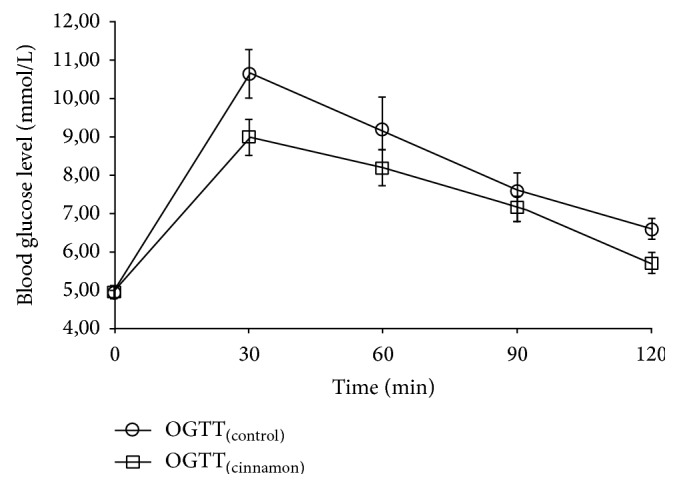
Mean (±SEM) time course of blood glucose levels (mmol/L) in nondiabetic subjects after OGTT(control) (○) and OGTT(cinnamon) (□).

Mean (±SEM) time course of blood glucose levels (mmol/L) in nondiabetic subjects after OGTT(control) (○) and OGTT(cinnamon) (□).