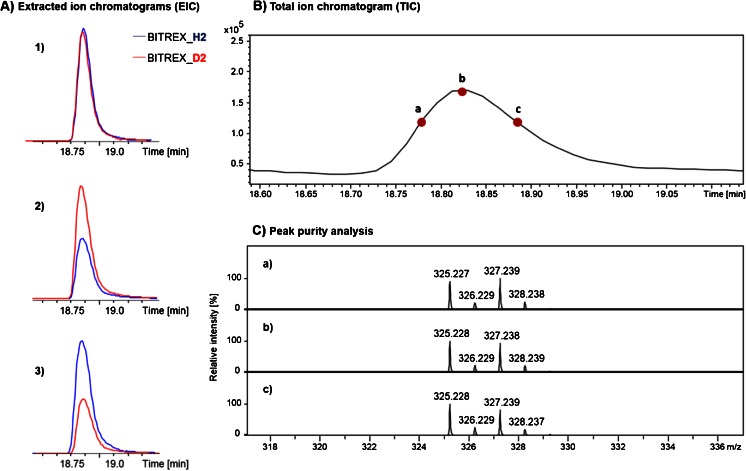
Fig. 2.
Extracted ion chromatograms (A) of deuterated and non-deuterated denatonium benzoate samples mixed in different ratios: (1) 1:1, (2) 2:1, and (3) 1:2. The total ion chromatogram peak at Rt 18.83 min was selected for peak purity analysis (B). The ESI-MS spectra presented for points a–c of the total ion chromatogram (C)

