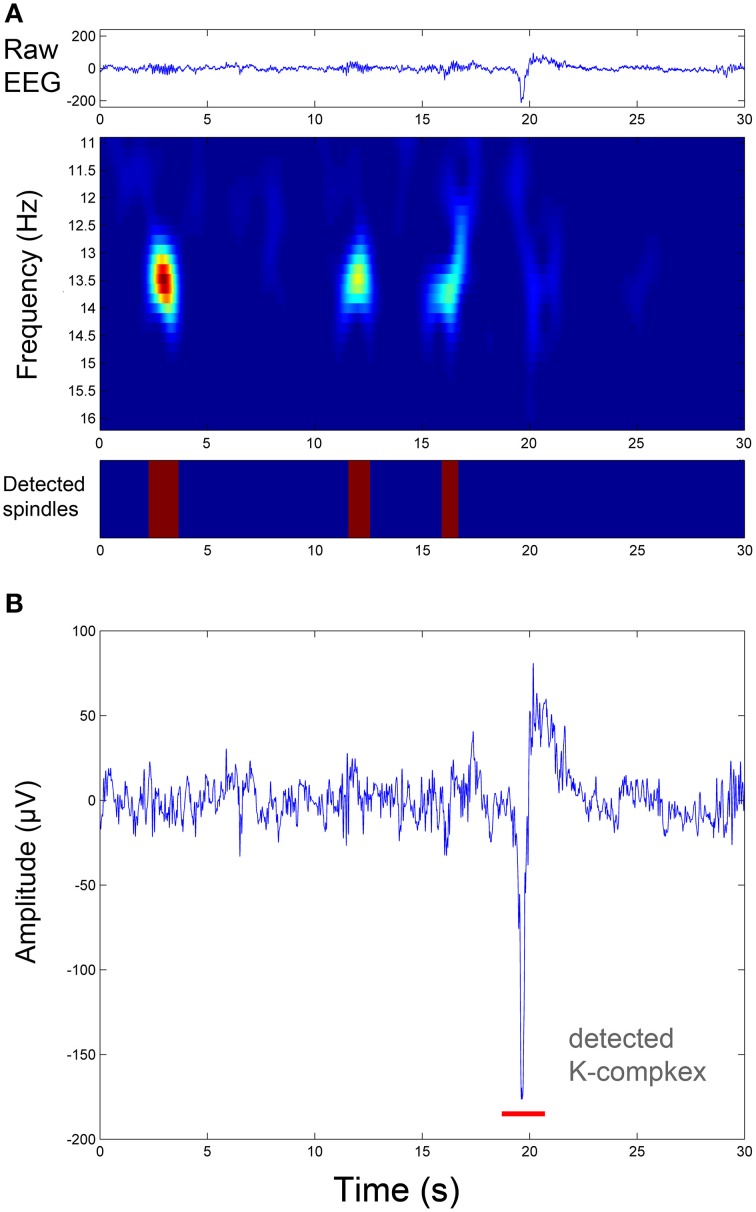
Figure 5.
Illustration of sleep spindle and K-complex detection in the same EEG segment shown in Figure 2. (A) Spindle detection procedure: from the raw EEG signal (upper panel) to the time-frequency representation of the oscillatory component resulting from the TQWT-MCA decomposition (middle panel), to spindle identification (lower panel). (B) The associated K-complex detection in the same segment by thresholding the transient component resulting from the TQWT-MCA decomposition (see Figure 2).

