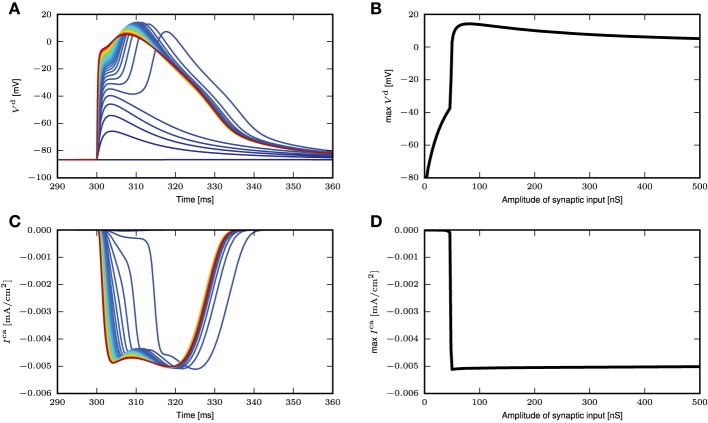
Figure 4.
Response of neuron model from Hay et al. (2011) to synaptic inputs. (A) Time course of distal membrane potential (650 μm from soma) for amplitude of synaptic conductance from 2 (blue) to 500nS (red), in intervals of 10nS. (B) The maximum membrane potential reached as a function of the amplitude of the synaptic conductance. (C) Time course of distal calcium current for high voltage activated calcium channels (650 μm from soma). Same color code as in (A). (D) The maximum calcium current amplitude reached as a function of the amplitude of the synaptic conductance.

