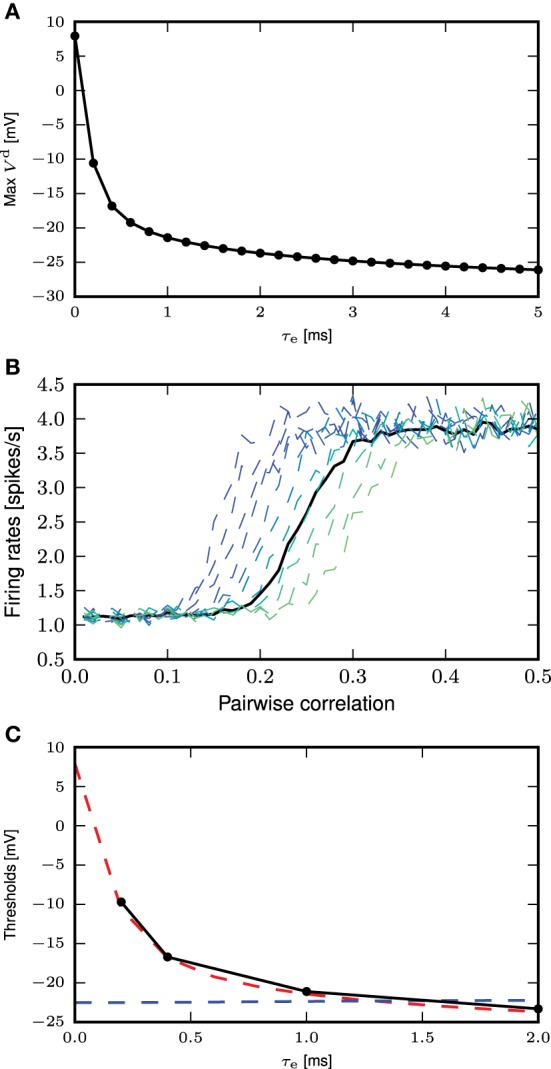
Figure 7.

Determining the calcium spike threshold using EPSP amplitude. (A) Maximum amplitude of the EPSP (without contribution from calcium spikes) evoked by the minimal conductance required to trigger a full calcium spike as a function of τe. (B) Firing rates for the neuron with first order kinetics (solid black curve) and with fixed waveform and different calcium thresholds (dashed curves, from blue to green, −20 to −10mV), against different amount of synchronous inputs with τe = 0.4ms. (C) Comparison of calcium spike threshold obtained by different approaches: results from simulation with background noise (black); derived from the minimum of the calcium potential slope (blue); derived from the maximum EPSP amplitude of the minimal spike triggering conductance (red).
