
Fig. 2.
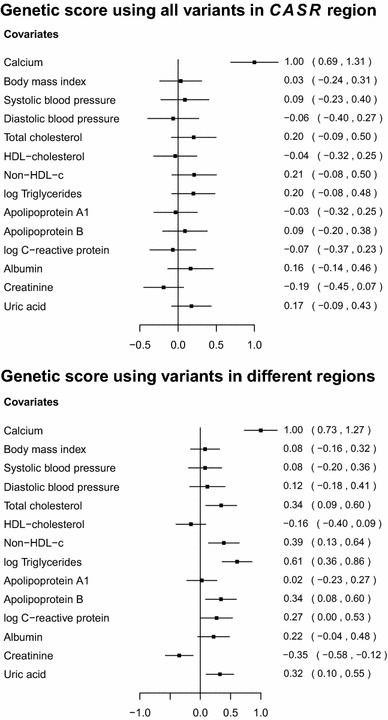
Associations with a range of covariates of weighted allele scores based on genetic variants associated with calcium levels for: (top) 17 variants in and around the CASR gene region; (bottom) 10 variants in different gene regions. Estimates are coefficients for the difference in the covariate measured in standard deviations per unit increase in the allele score [a unit increase in the allele score is scaled to be associated with a 1 standard deviation (0.13 mmol/L) increase in calcium levels]. Coefficients are obtained from the EPIC-InterAct dataset using linear regression with adjustment for age, sex and centre. Lines are 95 % confidence intervals