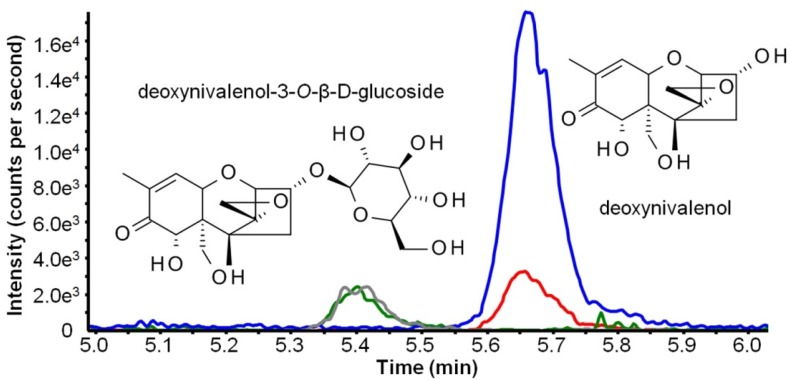
Figure 4.
Structure formula and extracted ion chromatogram of a standard containing 100 μg L−1 deoxynivalenol (DON) and DON-3-O-β-d-glucoside (D3G). Green (m/z 517.3 > m/z 59.1) and gray (m/z 517.3 > m/z 427.1) lines show selected reaction monitoring (SRM) traces for D3G. Blue (m/z 355.1 > m/z 59.2) and red (m/z 355.1 > m/z 265.2) lines show SRM traces for DON.

