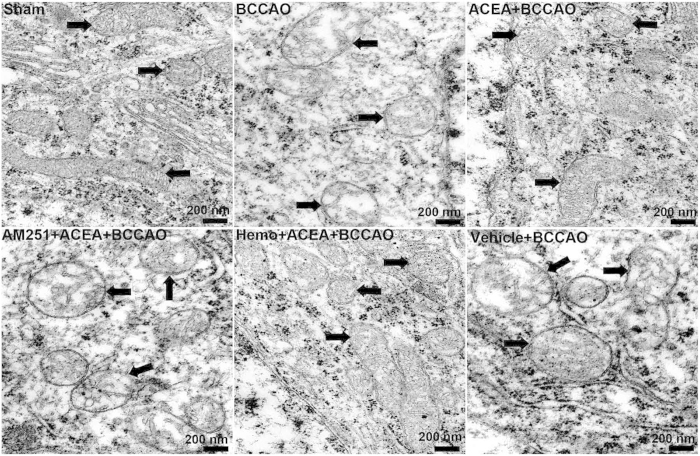
Figure 6. Transmission electron micrographs showing mitochondrial ultrastructure.
Representative electron microphotographs show mitochondrial ultrastructure in mouse CA1 hippocampal neurons at 72 h after the reperfusion (n = 3). Mitochondrial ultrastructures are indicated by arrows. Scale bars = 200 nm. BCCAO: bilateral common carotid artery occlusion; Hemo: hemopressin.

