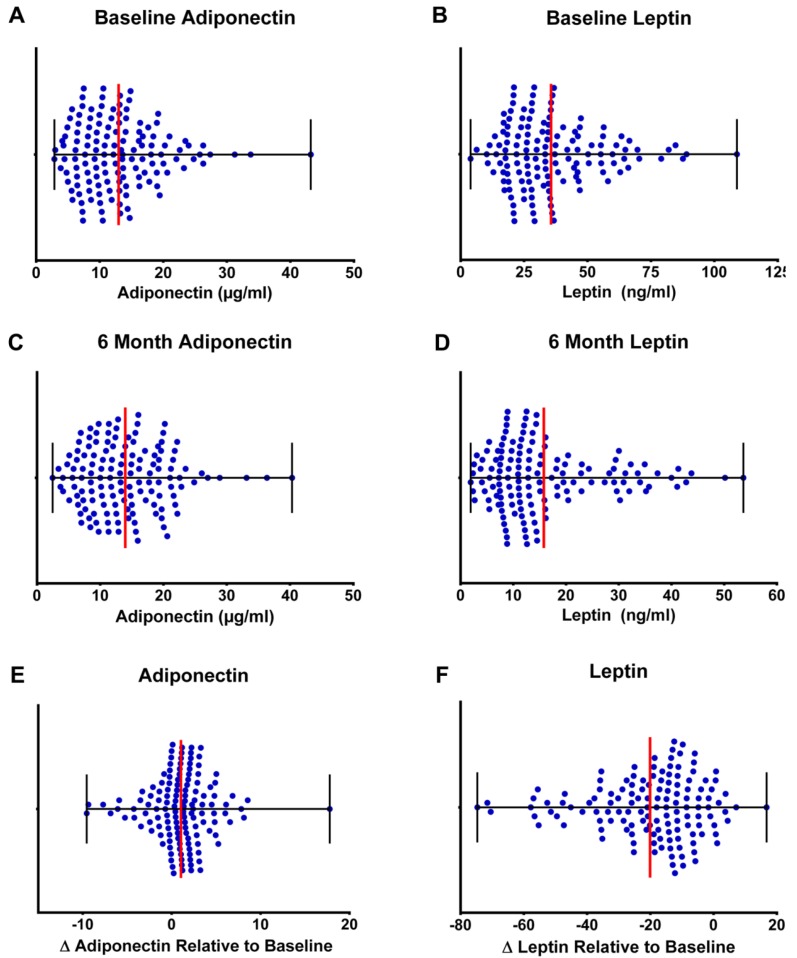
Figure 4.
Distribution of plasma adipokines at baseline and end of study. (a) Scatterplot showing the mean and range for plasma adiponectin and leptin at baseline. The plasma concentration of adiponectin that is observed in normal weight individuals is 7–5 µg/mL. Greater than 50% of participants in CHOICE were within this range at baseline. A concentration of 5 to 10 ng leptin per mL is typically observed in normal weight individuals. In this study, the mean leptin concentration at baseline was 36.0 ± 18.5 ng/mL. (b) Scatterplot showing the mean and range for plasma adiponectin and leptin at end of study. The plasma concentration of adiponectin that is observed in normal weight individuals is 7–15 µg/mL and 47% remained within this range by end of study and those percentages were not significantly affected by weight loss tertile or dietary pattern. Plasma leptin decreased to 15.8 ± 10.8 ng/mL by end of study; however, only in the highest tertile of weight loss did plasma levels reach the normal range of plasma concentrations (baseline 40.6 ±19.6 down to 10.0 ± 5.7 ng/mL). (c) Scatterplot showing the mean and range for the change (end of study-baseline) in plasma adiponectin (μg/mL) and leptin (ng/mL) at end of study relative to baseline. The distribution of change in plasma adiponectin indicates that 32% of the individuals in the intervention arms experienced a six-month decrease in adiponectin; whereas, the remainder increased somewhat. The distribution of change in plasma leptin indicates that 92% of participants in the weight loss intervention experienced a decrease in plasma leptin.

