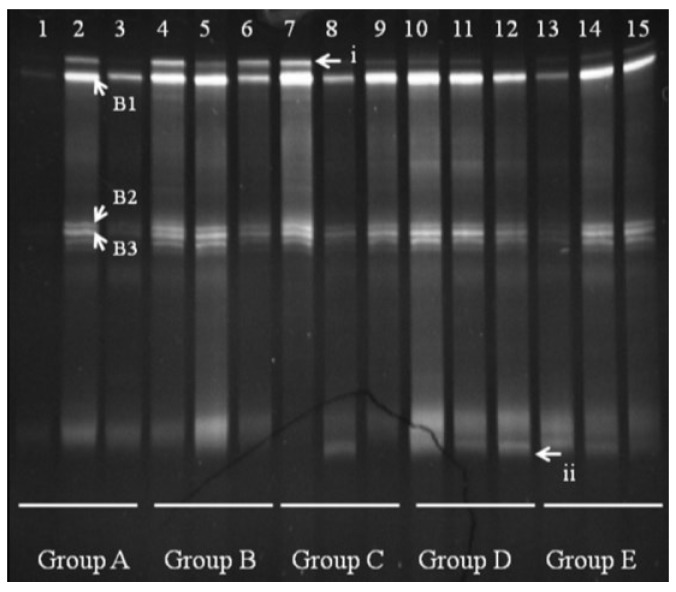
Figure 5.
Denaturing gradient gel electrophoresis (DGGE) for Bacteroides obtained from mouse distal colonic microbiota. Lanes 1–3 (Group A) represent normal controls. Lanes 4–6 (Group B) represent infection models. Lanes 7–9 (Group C) represent infected mice treated with low-dose FTBE. Lanes 10–12 (Group D) represent infected mice treated with middle-dose FBTE, and lanes 13–15 (Group E) represent infected mice treated with high-dose FBTE. The arrows (i–ii) indicate bands that changed in intensity. Representative bands (B1–B3) were excised for cloning and sequencing.

