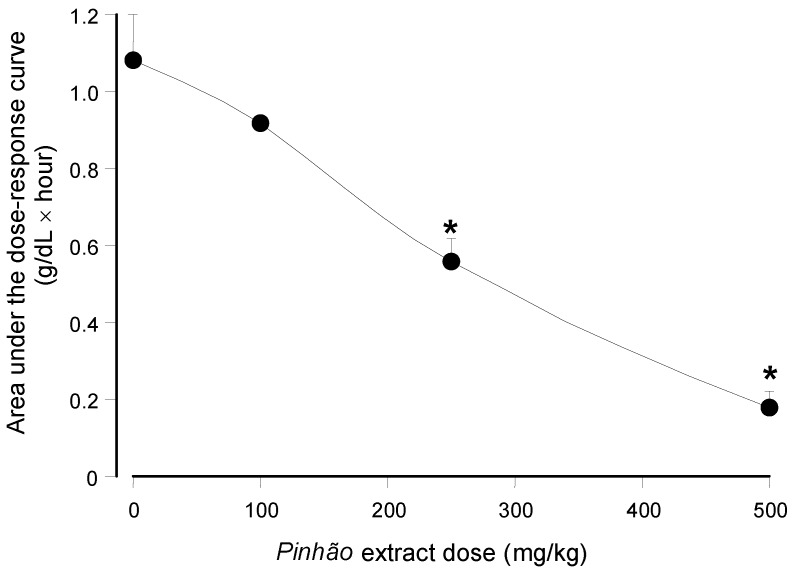
Figure 4.
Dependence of the area under the plasma triglyceride concentration versus time on the administered pinhão coat extract dose. The areas were obtained from the results shown in Figure 3. Each value represents the mean ± SD of three mice. Asterisks indicate statistical significance relative to the control (p ≤ 0.05 according to the Student–Newman–Keuls test).

