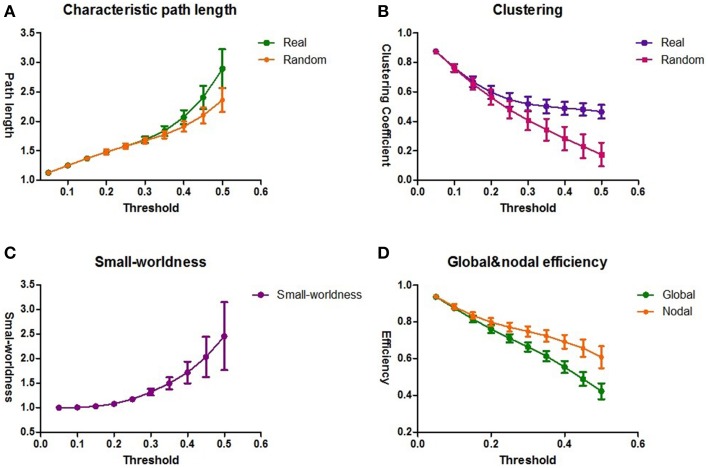
Figure 3.
The topological architecture of functional brain networks. The results of the group averaged characteristic path length L and Lrand (A) and the clustering coefficient C and Crand (B) for the thresholds 0.05 ≤ T ≤ 0.5. Lrand and Crand reflect the characteristic path length and clustering coefficient of a comparable random network. (C) The results of small-worldness for all the functional brain networks. The functional brain networks show a clear small-world organization, expressed by λ≈ 1 and γ >> 1. (D) The averaged global and nodal efficiency for all the functional brain networks. The standard deviations are shown as the error bars.

