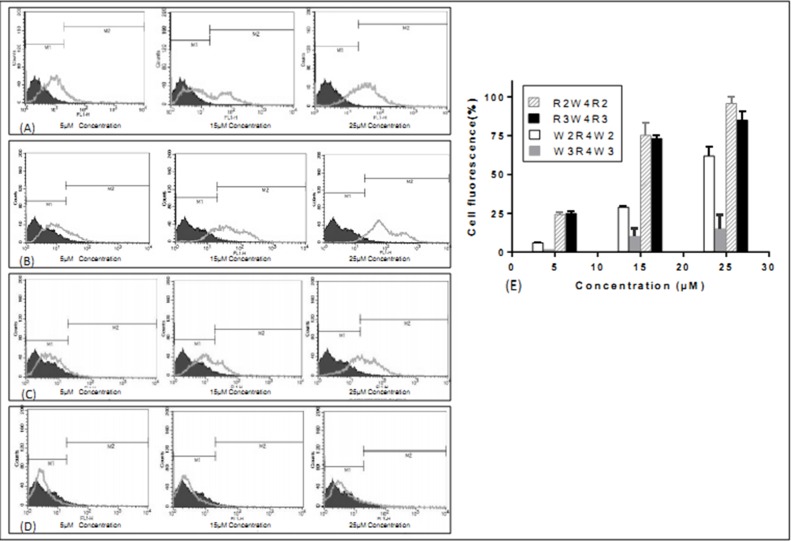
Figure 2.
Cellular uptake of FITC-labeled peptides in live MCF-7 cells after incubation for 1 h at 37 °C. The uptake values of intensity are seen for R2W4R2 (A) and R3W4R3 (B), followed by, in order of decreasing intensity, W2R4W2 (C), W3R4W3 (D). (E) A comparison of the cellular uptake of peptides in 5, 15, and 25μM concentrations. The results are expressed as a percentage of gated populations. Each value is the mean ± SD of two separate determinations.

