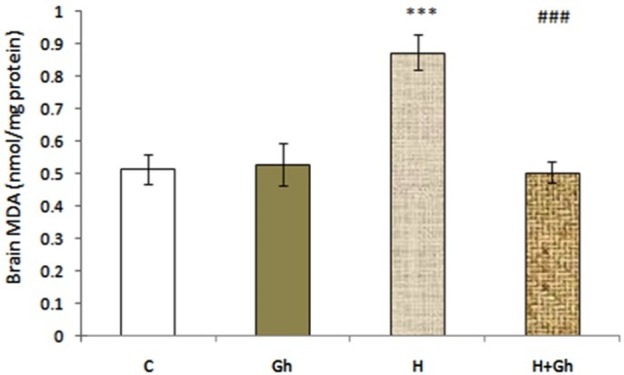
Figure 2.

Depicts the effect of two days of ghrelin (80 µg/kg/day) treatment on brain MDA level. Groups are abbreviated as following: Control (C), animals that received ghrelin (Gh), hypoxia (H), animals with hypoxic condition that received ghrelin (H+GH). Data are shown as Mean±SEM. *** p<0.001 when compared with control group and ### p<0.001 when compared to acute hypoxia group.
