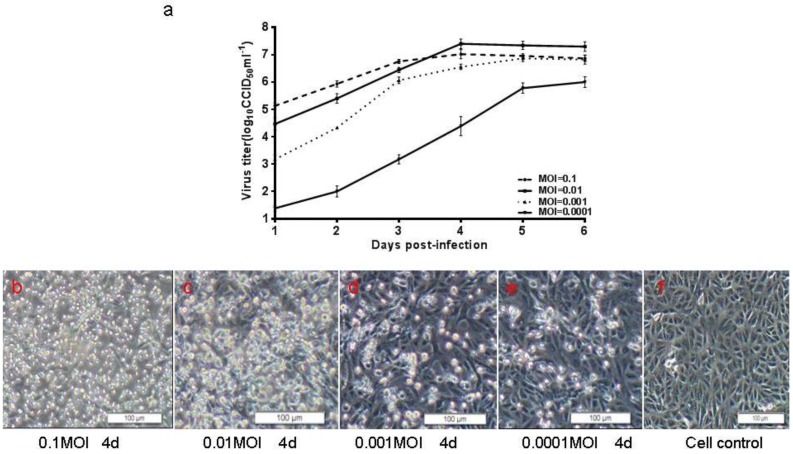
Figure 6.
Growth kinetics of CC-16 strain and images of infected Vero cells. (a) Confluent Vero cells in cell factories were infected with CA16 at the MOI of 0.0001, 0.001, 0.01 and 0.1. The highest titer was 107.5 CCID50/mL achieved with the MOI of 0.01; (b–f) Images of Vero cells infected with CC-16 on the fourth day post-infection; (g) Image of control Vero cells. Bar = 100 µm.

