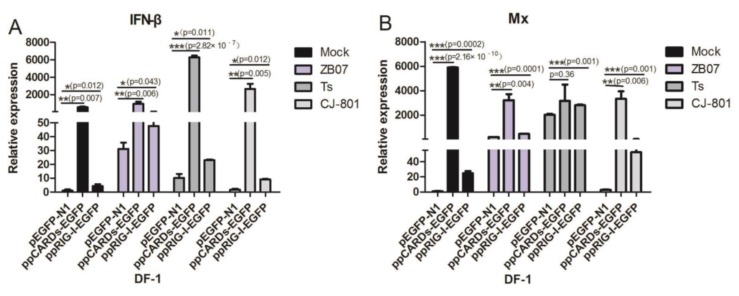
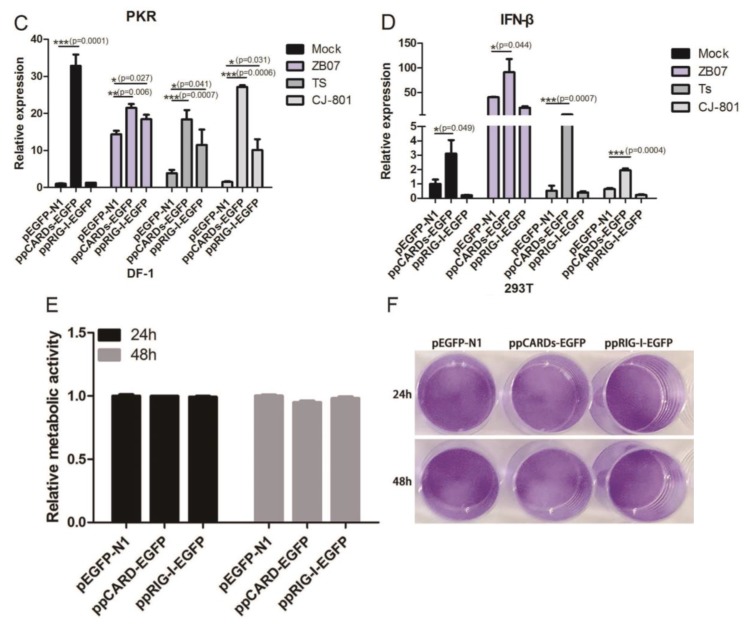
Figure 5.
IBDV and ZB07 induced antiviral gene expression in pigeon CARDs and RIG-I transfected DF-1 and 293T cells. (A–C) DF-1 cells were transfected with pEGFP-N1, ppCARDs-EGFP and ppRIG-I-EGFP, then, 24 h later, the transfected cells were infected with CJ-801, TS, ZB07 viruses or mock-treated. RNA was extracted and the IFN-β, Mx, and PKR mRNA expression were determined by qRT-PCR at 8 h p.i.; (D) 293T cells were transfected with pEGFP-N1, ppCARDs-EGFP and ppRIG-I-EGFP. Then, 24 h later, the transfected cells were infected with CJ-801, TS, ZB07 viruses or mock-treated. RNA was extracted and the IFN-β mRNA expression were determined by qRT-PCR at 8 h p.i.; (E) DF-1 cells were transfected with ppCARDs-EGFP, ppRIG-I-EGFP, and pEGFP-N1, then, 24 and 48 h later, metabolic activity was measured using the MTT assay; (F) DF-1 cells were transfected with ppCARDs-EGFP, ppRIG-I-EGFP, and pEGFP-N1. Then, 24 and 48 h later, crystal violet staining was used to assess cytotoxic effects. Data represent mean ± SEM from three wells per group. Results are representative of three independent experiments. Data represent mean ± SEM from three wells per group. * p ≤ 0.05 vs. pEGFP-N1; ** p ≤ 0.01 vs. pEGFP-N1; *** p ≤ 0.001 vs. pEGFP-N1. Results are representative of two independent experiments.


