Figure 3.

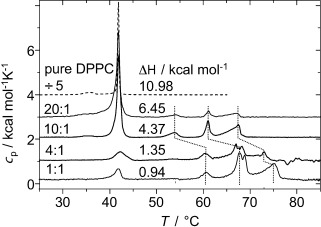
DSC thermograms of MLV preparations of pure DPPC and of B12 in mixtures with DPPC with different molar ratios. The indicated ΔH values refer to the sum of the pre- and main transition of DPPC in units of kcal mol−1 lipid.

DSC thermograms of MLV preparations of pure DPPC and of B12 in mixtures with DPPC with different molar ratios. The indicated ΔH values refer to the sum of the pre- and main transition of DPPC in units of kcal mol−1 lipid.