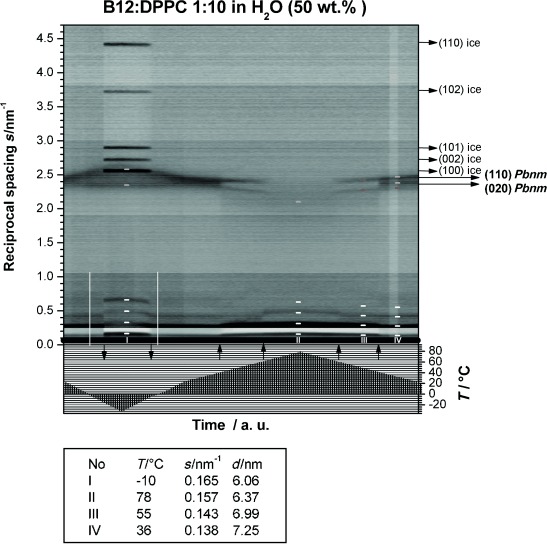
Figure 4.

X-ray contour plot of aqueous suspensions of B12/DPPC (1:10) with 50 wt % H2O. In the upper part, the scattering intensities are plotted in grayscales (reciprocal spacing axis at the left-hand side) and the temperature profile is plotted in the lower part (temperature axis at the lower right-hand side). Arrows pointing upwards mark phase transitions, and arrows pointing downwards show the freezing and melting of excess water. Scattering curves at 0 °C are highlighted with white vertical lines. At temperatures between the freezing and melting of water, sharp ice reflections appear that are indexed with horizontal arrows in the right-hand border. Small-angle X-ray scattering (SAXS) reflections at temperatures I–IV are marked with white horizontal dashes and respective reflections of the wide-angle X-ray scattering (WAXS) region with yellow or red dashes (two phases). The WAXS reflection indexing in the right-hand border (long horizontal arrows) refers to the lipid-rich phase. The box at the bottom shows the repeat distances at the marked temperatures (I–IV).
