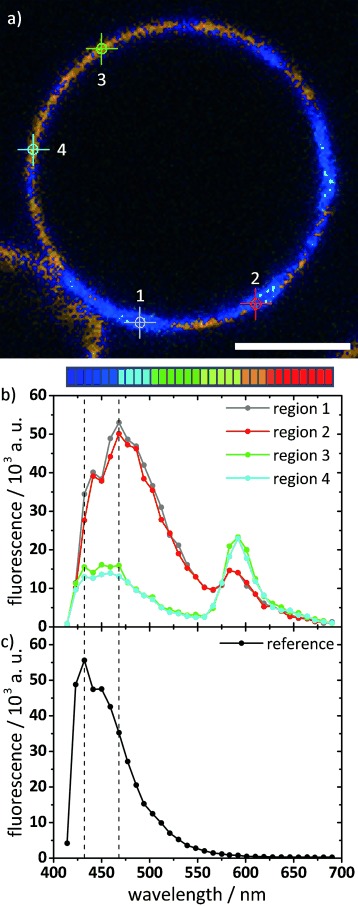
Figure 7.

Spectrally resolved CFM of GUVs from B12/DPPC (1:10), counterstained with Rh-PE. a) Confocal slice image color-coded by wavelength, as indicated by the color palette below (32 channels, λ=414 to 690 nm, 8.9 nm resolution). Scale bar=5 μm. Imaging was performed at room temperature. b) Corresponding spectral plots for the four regions indicated by circles in the confocal image. Regions 1 and 2 are located in the B12-rich star-shaped domains; regions 3 and 4 are in the surrounding phase. The peak at λ≈470 nm (which is higher within the domains) is due to B12 emission; the peak at λ≈590 nm (which is higher outside the domains) is due to Rh-PE emission. c) As a reference, the spectrally resolved fluorescence of B12 in chloroform/methanol was recorded on the same setup, and showed a peak at λ≈430 nm.
