Figure 1.

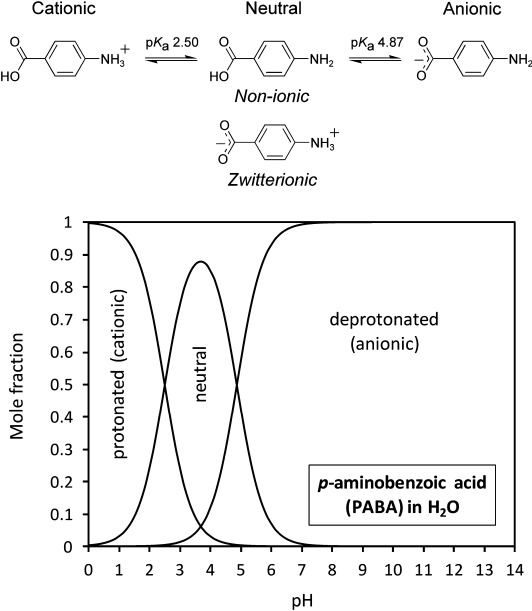
Equilibria between the cationic, neutral and anionic PABA species in water (top) and speciation diagram as a function of pH (bottom).

Equilibria between the cationic, neutral and anionic PABA species in water (top) and speciation diagram as a function of pH (bottom).