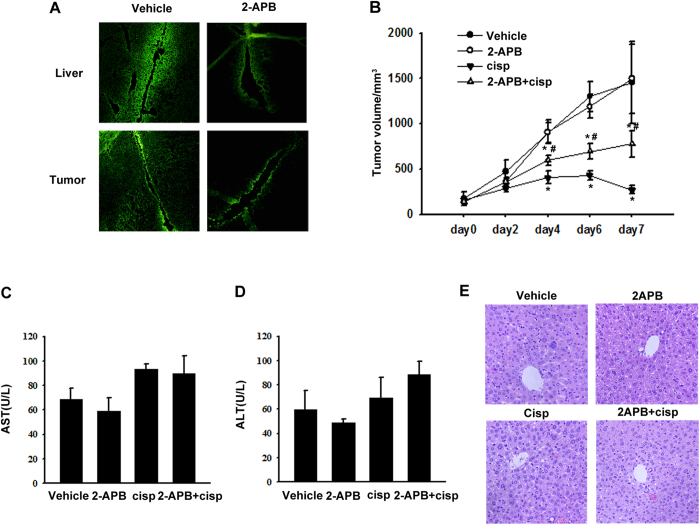
Figure 4. Effect of GJIC on tumor xenograft growth and cisplatin-induced hepatoxicity.
(A) Tissue GJIC was evaluated by scrape-loading/dye transfer assay in mice liver and tumor. (B) Volume of tumors in each treatment group. *P < 0.05, differs significantly from the vehicle group; #P < 0.05, differs significantly from the cisplatin group (n = 10). (C,D) Serum AST and ALT levels (E) and HE liver histology (n = 10). The scale bars represent 20 μm.

