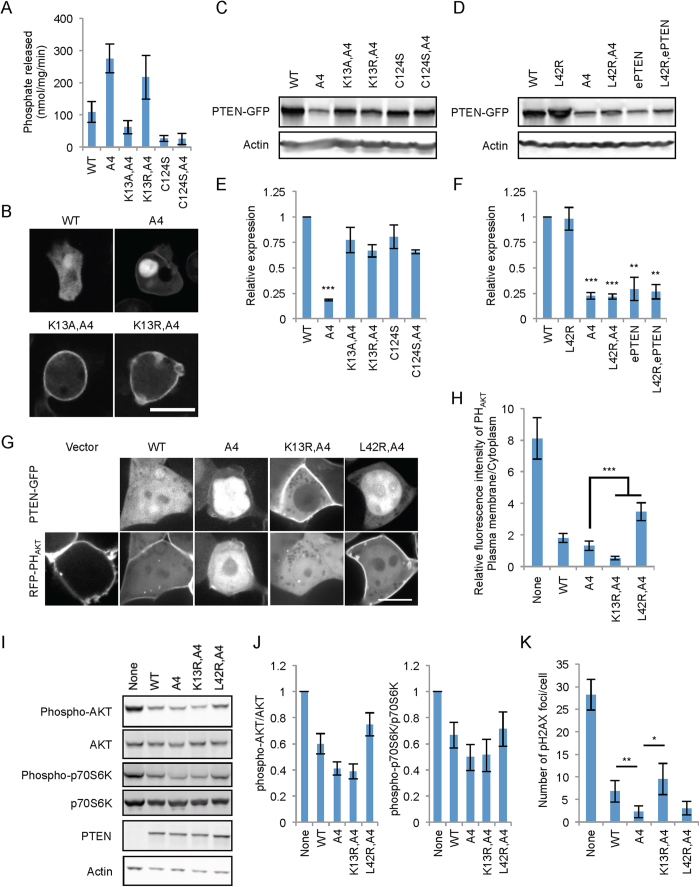
Figure 3. K13 controls the stability of PTEN, but not its membrane association.
(A) The indicated PTEN-GFP proteins were immunopurified from Dictyostelium cells, and phosphatase activities were measured. Values represent the mean ± SD (n = 3). (B) Dictyostelium cells expressing various PTEN-GFP constructs were observed by fluorescence microscopy. Bar, 10 μm. (C,D) Immunoblotting of whole-cell lysates prepared from Dictyostelium cells expressing PTEN-GFP variants was performed using antibodies to GFP and actin. (E,F). The band intensity was quantified relative to actin. Values represent the mean ± SD (n = 3). (G) HEK293 cells expressing the PIP3 biosensor RFP-PHAKT along with the indicated forms of PTEN-GFP were observed by fluorescence microscopy. Bar, 10 μm. (H) Intensity of RFP at the plasma membrane was quantified relative to that in the cytosol. Values represent the mean ± SD (n ≥ 8). (I) HEK293T cell lysates containing the indicated PTEN-GFP constructs were analyzed by immunoblotting with antibodies to phospho-AKT, AKT, phospho-p70S6K, p70S6K, PTEN, and actin. (J) Quantification of band intensity. The band intensity of phospho-AKT and phospho- p70S6K was quantified relative to AKT and p70S6K, respectively. Values represent the means ± SDs (n = 3). (K) Quantification of γH2AX foci after 16-h hydroxyurea treatment. Values represent the means ± SEMs (n = 10).

