
Fig. 4.
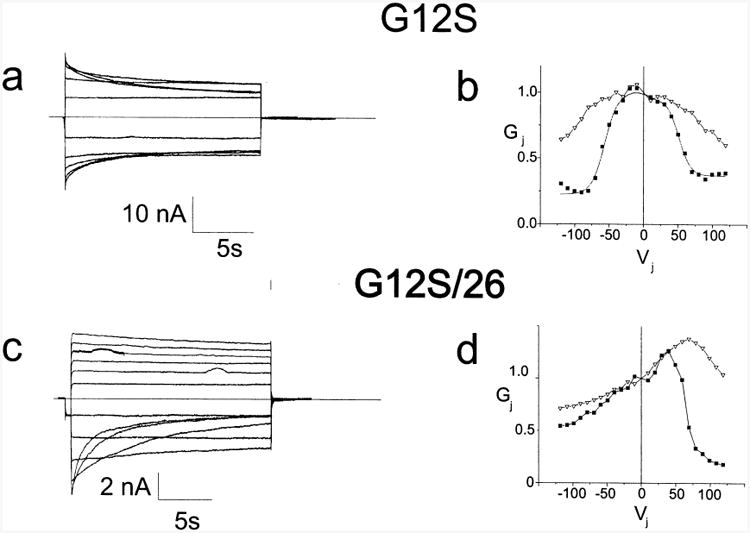
Representative current traces and Gj–Vj relations for G12S paired homotypically and heterotypically with 26WT. Figs. 4a and b. Representative current traces and Gj–Vj relations for G12S paired homotypically. Current traces were analyzed as described in the Methods; the smooth curve approximating the steady state data corresponds to the curve generated by fitting the data to a Boltzmann distribution. Figs. 4c and d. Representative current traces and Gj–Vj relations for G12S paired heterotypically with 26WT. Individual points are connected for clarity. For a and c only traces in 20 mV increments from ±20 to ±120 are shown. Filled squares-steady state conductances; hollow triangles-instantaneous conductances. Current traces and Gj–Vj relations are representative of findings in at least three independent experiments.