
Fig. 3. Higher frequency of DENV-2 infection in DENV-1–immune children in later (2006/7–2008/9), versus earlier (2005/6) seasons.
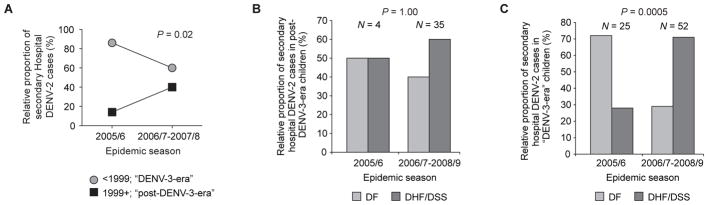
(A) Relative proportion of secondary DENV-2 cases in the Hospital study that occurred across seasons, stratified by birth group (circles, <1999, “DENV-3-era”; squares, 1999+, “post-DENV-3-era”; P = 0.02, Rao Scott chi square test, comparing the proportion of secondary DENV-2 Hospital cases from the “post-DENV-3-era” birth group (as opposed to the “DENV-3-era” birth group) in early versus later seasons, adjusting for the decreased representation of children from the older birth group in later seasons). (B) Relative proportion of secondary DENV-2 cases in “post-DENV-3-era” children (1999+) in the Hospital study classified as DF (light gray bars) or DHF/DSS (dark gray bars) (P = 1.00; Fisher’s exact test, comparing the proportion of secondary DENV-2 Hospital cases that are DHF/DSS in early versus later seasons among “post-DENV-3-era” children). (C) Relative proportion of secondary DENV-2 cases in “DENV-3-era” children (<1999) in the Hospital study classified as DF (light bars) or DHF/DSS (dark gray bars) (P = 0.0005; Fisher’s exact test, comparing the proportion of secondary DENV-2 Hospital cases that are DHF/DSS in early versus later seasons among “DENV-3-era” children).